OUR 9TH YEAR OF PROVIDING PROPRIETARY CAPITAL MARKETS INTELLIGENCE ON THE CANNABIS / HEMP / PSYCHEDELIC SECTORS
Quick
Links
Past Charts
Home » Viridian Capital Chart of the Week: The Impact of 280e, High Leverage, & High Capital Intensity on Cannabis Growth
Chart of the Week
Chart of the Week
The Viridian Capital Chart of the Week highlights key investment, valuation and M&A trends taken from that week’s Deal Tracker that we believe are impactful for investors, companies and acquirers.
Week ended 09/01/2023
Viridian Capital Chart of the Week: The Impact of 280e, High Leverage, & High Capital Intensity on Cannabis Growth
- Last Week’s Viridian Chart of the Week explored the relative capital intensity of cannabis compared to other industries that cannabis, including alcohol, tobacco, pharmaceuticals, and CPG. The results established that cannabis is the most capital-intensive of these industries in terms of incremental capital required per dollar of additional sales.
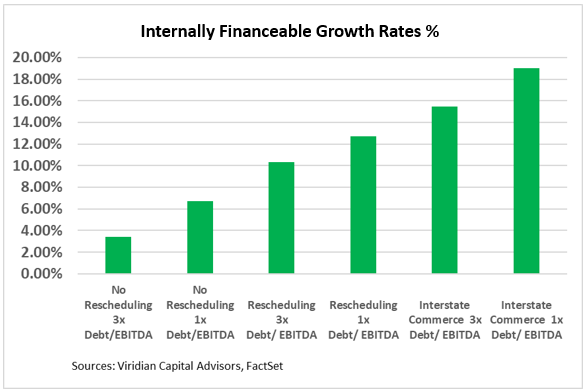
- The graph below takes this analysis one step further. It explores the degree to which punitive 280e taxes, high leverage, and high capital intensity restrict the internally financeable growth potential of the industry.
- Our analysis follows the general approach of Robert Higgins in his seminal article “How Much Growth Can a Firm Afford?” Financial Management, 1977, but departs from his analysis in two important respects. Higgins postulated that an increase in equity from earnings could also allow an increase in debt to keep the capital structure ratios constant. In contrast, we have assumed no incremental debt financing. Higgins also thought that depreciation would need to be matched with capex to keep the book value of fixed assets constant. We have assumed that in the short run, firms can utilize the depreciation cash flow to fund growth, a reasonable assumption for firms with relatively new capital plants.
- To generate the numbers in the chart, we assumed gross margins of 47% and SG&A of 20%, roughly matching group consensus estimates for the next twelve months. We also assumed a 15-year fixed asset life, 10% average interest expense, and the 61x sales/capital employed ratio we calculated last week.
- We calculate a Net Debt/ NTM EBITDA ratio of 3x for the group in the graph and show that with 280e taxes, 3x leverage, and .61x Sales/ Capital employed, the group can only grow sales at an anemic 3.4% without external capital. A competitor with only 1x leverage could grow at 6.7% without external capital.
- The chart shows that removing 280e by rescheduling can nearly double the rates of internally financeable growth. However, the high capital intensity of cannabis will not be reduced since rescheduling will not allow interstate commerce.
- The last two bars on the right show the further internal growth potential accompanying interstate commerce. We assumed Sales/capital employed could increase to as high as .9x, still lower than CPG but a bit higher than Pharmaceuticals. The chart shows the tremendous additional growth capacity.
- Restricted cannabis capital markets, high leverage, punitive 280e taxes, and high capital intensity have conspired to limit the growth potential of the cannabis industry. By eliminating 280e, rescheduling will significantly increase the industry’s ability to grow without external capital. We believe, however, that rescheduling is also likely to lead to a reopening of cannabis capital markets through the entrance of new institutional investors. Combining these factors could lead to the reigniting of the cannabis growth engine.