OUR 9TH YEAR OF PROVIDING PROPRIETARY CAPITAL MARKETS INTELLIGENCE ON THE CANNABIS / HEMP / PSYCHEDELIC SECTORS
Quick
Links
Past Charts
Home » Viridian Capital Chart of the Week: Screening for Investable Cannabis Companies With Less Than $250M Market Cap
Chart of the Week
Chart of the Week
The Viridian Capital Chart of the Week highlights key investment, valuation and M&A trends taken from that week’s Deal Tracker that we believe are impactful for investors, companies and acquirers.
Week ended 02/28/2025
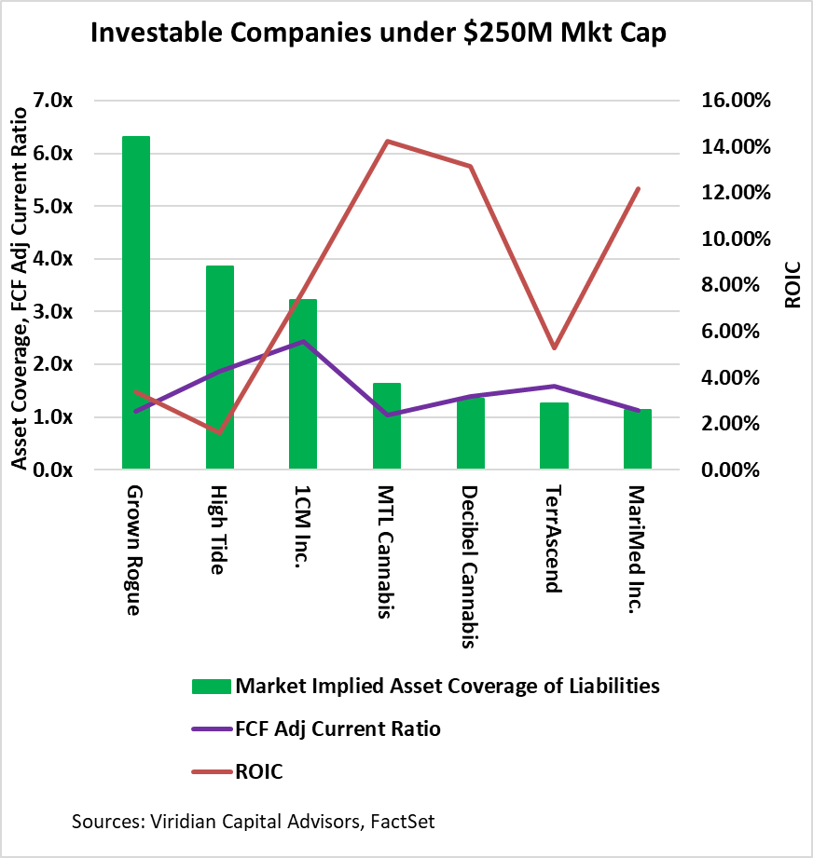
Viridian Capital Chart of the Week: Screening for Investable Cannabis Companies With Less Than $250M Market Cap
- 4th quarter 2024 earnings releases are rolling in, and unsurprisingly, Green Thumb (GTII: CSE) and, to a slightly lesser extent, Trulieve (TRIL: CSE) are beating estimates soundly while showing strong liquidity, cash flow, and revenues.
- The Viridian Chart of the Week asks the question, “Aren’t there smaller, less recognized companies in the cannabis universe that are investable other than GTI, Trulieve, Cresco, and Verano? And if there are, what criteria would we apply to try to find them?
- We have maintained for some time that credit analysis is the new equity analysis. Investors and companies are rightfully placing less attention on revenue growth and geographical expansion. They are focusing more on how companies are situated to withstand the current inhospitable environment characterized by unrelenting capital scarcity, ongoing cost pressures, wholesale price compression, and lack of any visible help from Washington, D.C.
- We started with a list of 72 U.S. and Canadian Cultivation and Retail Sector Companies and applied four filters to arrive at the seven companies on the chart:
- We restricted the sample to companies with positive LTM Cash Flow from Operations.
- We eliminated companies with negative returns on Invested Capital. The red line on the chart depicts ROIC. Most companies have ROICs that are lower than their weighted average costs of capital, which we believe start at around 10%, so there is plenty of room for improvement here. Still, at least these companies are in positive territory.
- We eliminated any company with less than 1x asset coverage of liabilities. Our methodology relies on treating the value of a company’s equity as a call option on the value of the assets with a strike price of the liabilities and assumptions on the maturity of liabilities, volatility, and risk-free rate. Knowing all of the inputs like the market cap, total liabilities, etc, we can tease out the market’s assessment of asset values. The green bars show our estimated asset value coverage.
- Finally, we wanted to feel comfortable that the companies have sufficient liquidity to withstand the current environment. Our favorite liquidity measure, shown by the purple line, is our bespoke Free Cash Flow Adjusted Current Ratio, where we modify the classic current ratio by adding or subtracting an estimate of annual free cash flow. Companies with negative free cash flow must maintain more significant balance sheet reserves to make up for the cash burn.
- Nothing presented here should be viewed as investment advice, but we think the chart offers a good starting point for looking for lesser-known companies with the right characteristics.