OUR 9TH YEAR OF PROVIDING PROPRIETARY CAPITAL MARKETS INTELLIGENCE ON THE CANNABIS / HEMP / PSYCHEDELIC SECTORS
Quick
Links
Past Charts
Home » Viridian Capital Chart of the Week: Q2 EBITDAs Beat Estimates, but Full-Year Projections Tell a Different Story
Chart of the Week
Chart of the Week
The Viridian Capital Chart of the Week highlights key investment, valuation and M&A trends taken from that week’s Deal Tracker that we believe are impactful for investors, companies and acquirers.
Week ended 08/25/2023
Viridian Capital Chart of the Week: Q2 EBITDAs Beat Estimates, but Full-Year Projections Tell a Different Story
- Second quarter 2023 earnings releases are complete, and the results were fascinating. One of the things that makes us skeptical about these quarterly reports is the forceful steering that companies apply to try to move estimates down.
- We generally lay out the earnings schedule weeks in advance and enter the expected revenues and EBITDA for each company. When we updated actuals this quarter, we noted that analysts had markedly lowered EBITDA estimates from what they had a couple of weeks earlier! It appears that corporate IR had talked analysts down to make it easier to beat the consensus estimates. It clearly worked! Ten of the fourteen companies on the chart beat their revised estimates – as easy as shooting fish in a barrel!
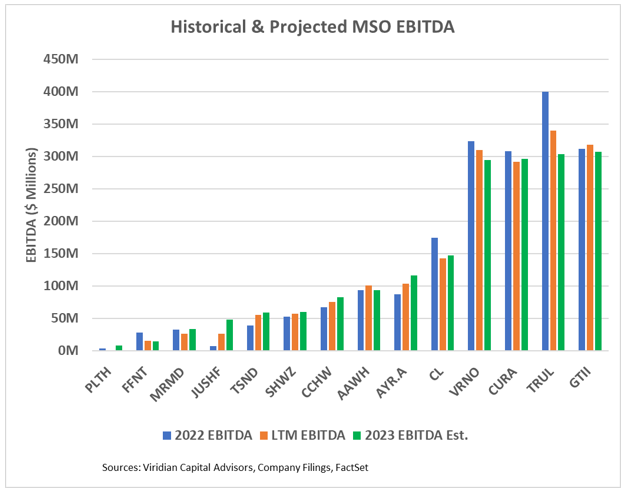
- We have always found the longer-term estimates to be more interesting and predictive. The chart shows actual 2022 EBITDA, LTM EBITDA, and consensus 2023 EBITDA estimates for fourteen of the largest MSOs.
- Note that six of the fourteen, including the five largest MSOs, have lower expected 2023 EBITDA than actual 2022 EBITDA. The group, in aggregate, is projected to be down 3.2% for 2023. The pattern of achieving this is also interesting. Q1: 23 EBITDA was down 5.5% from Q1: 22. Q2: 23 was down a larger 8.4% versus the year-earlier (despite those estimate beats!) But H2: 23 EBITDA is projected to increase by .4% versus H2: 22.
- We are frankly skeptical about this projected turnaround. Corporate IR people have consistently pointed to the benefits of Maryland and price rationalization in Illinois as reasons for this uptick, but these simply do not seem large enough to make the difference.
- Aggressive inventory management is likely to restrain the 2nd half EBITDA snapback. Companies are aggressively cutting inventory, prioritizing cash flow generation over margins. This is apparent from Q2:23 financials. The average days of inventory for q2 were 107 days, down from 115 days at the end of Q1. Six of the fourteen companies had lower inventory days. This probably was a factor in the gross margin decline for the group from 40% in Q1 to 39% in Q2. We believe these efforts are ongoing and likely to pressure gross margins in H2.
- Analysts were persuaded to cut their Q2 EBITDA estimates but have left H2 23 assessments at suspect levels. We believe further reductions in 2023 EBITDA estimates are likely. Of course, a case-by-case analysis is necessary. TerrAscend (TSND: Nasdaq) may be an example of where Maryland does make the difference. Similarly, AYR’s (AYR.A: CSE) growing market share in Florida may explain its higher 2023 EBITDA. Nonetheless, it is clearly a time for caution.