OUR 9TH YEAR OF PROVIDING PROPRIETARY CAPITAL MARKETS INTELLIGENCE ON THE CANNABIS / HEMP / PSYCHEDELIC SECTORS
Quick
Links
Past Charts
Home » Viridian Capital Chart of the Week: Is Consolidation Increasing in Cannabis?
Chart of the Week
Chart of the Week
The Viridian Capital Chart of the Week highlights key investment, valuation and M&A trends taken from that week’s Deal Tracker that we believe are impactful for investors, companies and acquirers.
Week ended 03/22/2024
Viridian Capital Chart of the Week: Is Consolidation Increasing in Cannabis?
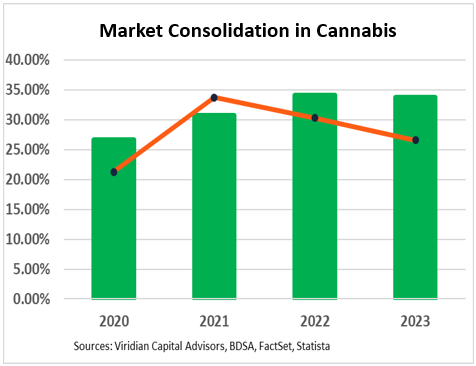
- Viridian noted in a Chart of the Week published in November 2022 that increased “consolidation is inevitable” in the Cannabis industry. What does the latest data show?
- The green bars in the graph show data from BDSA that Viridian presented at the Green Market Finance Summit at NECANN on March 22. The orange line is an alternate calculation based on company financial statements. Although both data sets show a higher concentration level in 2023 than 2020, the recent direction differs. Which one is correct, and what is the likely future direction?
- The BDSA data shows the share of sales by the top 20 brand houses each year. Note that the top 20 may be different each year. BDSA aggregated all retail sales of the brands associated with a brand house. For example, all of the retail sales by Green Thumb brands are added, whether GTI makes the retail sale at one of its dispensaries or someone else sells the product purchased from Green Thumbs on the wholesale market. This approach puts everything on a retail basis.
- The financial statement calculation is more straightforward: aggregating the highest twenty company revenues each year divided by the Statista total retail sales number. This approach, however, is biased downward for two reasons. The total revenue for each company is a combination of retail and wholesale revenue, and this approach neglects to include the retail markup on the wholesale sales. The Viridian database also includes only public companies; large brands like Stiizy are not represented. We conclude that the BDSA approach is superior, and its demonstration of increased consolidation in recent years is likely accurate.
- Further increases in concentration are likely. The beer industry is a good analog. Like in cannabis, there are over 10,000 small craft beer companies, but the top five account for more than 60% of sales. Wine is another interesting example. There are over 1800 brands of wine sold in the U.S. Still, five companies (E&J Gallo, The Wine Group, Constellation Brands, Tranchero Family Estates, and Treasury Wine Estates) own the brands that make up over 60% of sales.
- Why did both wine and beer consolidate to such a degree? Economies of scale in production, packaging, distribution, and marketing drove the consolidation, and those same factors will drive consolidation in cannabis.
- As capital markets reopen after rescheduling, larger, more liquid companies will be the first to benefit from incremental investment in the industry. Their cost of capital advantage will make it easier for them to grow relative to their smaller competitors. Full legalization, when and if it happens, will accelerate consolidation pressures. Larger regional cultivation and production facilities with significant cost advantages will likely emerge. Tremendous expenditures will be required to build brand awareness and conduct nationwide advertising programs. The largest MSOs today are tiny companies in the landscape of American commerce. Either they will grow much larger or be acquired by larger companies from outside the industry. There will always be thousands of small cannabis companies, and those with superior marketing skills to establish niche positions with differentiated products will thrive, while those that do not disappear.