OUR 9TH YEAR OF PROVIDING PROPRIETARY CAPITAL MARKETS INTELLIGENCE ON THE CANNABIS / HEMP / PSYCHEDELIC SECTORS
Quick
Links
Past Charts
Home » Viridian Capital Chart of the Week: How Much Are U.S. MSOs Undervalued Compared to Other Industries?
Chart of the Week
Chart of the Week
The Viridian Capital Chart of the Week highlights key investment, valuation and M&A trends taken from that week’s Deal Tracker that we believe are impactful for investors, companies and acquirers.
Week ended 04/19/2024
Viridian Capital Chart of the Week: How Much Are U.S. MSOs Undervalued Compared to Other Industries?
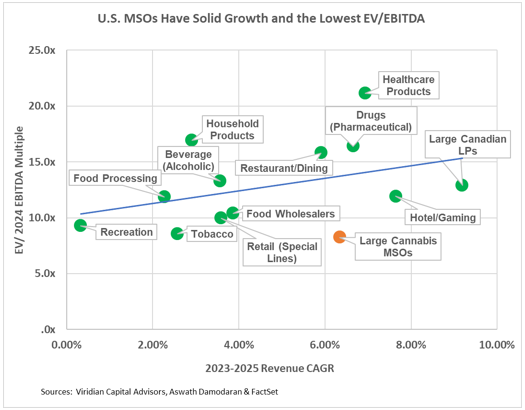
- The chart shows Enterprise Value to 2024 consensus EBITDA multiples on the vertical axis against 2023-2025 Revenue CAGR on the horizontal axis for thirteen different industries.
- We last explored this topic in the 6/24/22 Viridian Capital Chart of the Week and wanted to explore the impact of the rescheduling expectations on the industry’s relative positioning.
- We used data from 295 companies organized into 13 different industry categories. The assignment of companies into industry groupings follows the work of Aswath Damodaran, a noted finance professor at NYU. Valuation multiples and revenue growth rates were calculated by aggregating all companies in the industry group before calculating the respective ratios.
- The top 10 MSOs by market cap collectively have an expected 6.3% compounded revenue growth rate for the next two years, down significantly from the nearly 30% value we measured two years ago. Analysts are arguably being too conservative in their estimates, especially given the potential for Florida, Pennsylvania, and Virginia to go adult rec. Some hopeful signs are also appearing, such as California and New York beginning to tackle their illicit market issues. Still, wholesale price compression is an ongoing reality, and the number of large states that have not yet passed recreational cannabis is shrinking.
- The MSO group has an 8.24x EV/ 2024 consensus EBITDA multiple (compared to 4.8x on 6/24/22), significantly lower than any other industry group despite its 2024 EBITDA margin of 26.2%, the fourth-highest behind Tobacco (48.7%), Pharmaceuticals (36.8%), and Alcoholic Beverages (28.1%).
- We note, however, that cannabis EBITDA is not strictly comparable to the other sectors due to the impact of 280e. Deflating EBITDA by 5/8 to account for relative tax treatments (admittedly a very rough approximation) would produce a 13.2x multiple. Much of the observed lower multiple, therefore, derives from the adverse tax treatment. The The blue line represents the regression line through the points, and cannabis has a predicted multiple of 13.7x. The regression equation suggests that adding one percentage point of CAGR should result in an approximately .5x increase in valuation multiple.
- Cannabis is the only sector on the chart with several potential catalysts that could materially affect value.
- Legalization Initiatives: Although we believe full legalization is still years away, rescheduling with the removal of 280e is likely to be announced prior to the election. We are less optimistic about the SAFER Act or its derivatives.
- Consolidation: We believe significant industry consolidation is still to come in cannabis. Even the largest MSOs are quite small by American industry standards. The average EV of the largest 10 MSOs is only $1.6B compared to $22B, $55B, and $127B for the Alcohol, Pharmaceuticals, and Tobacco companies represented on the chart. A few significant M&A transactions or strategic investments from outside the industry could propel valuations upward.
- The timing of the likely catalysts is impossible to forecast, and investors need to have a long time horizon to reap the benefits of cannabis margin expansion.