OUR 9TH YEAR OF PROVIDING PROPRIETARY CAPITAL MARKETS INTELLIGENCE ON THE CANNABIS / HEMP / PSYCHEDELIC SECTORS
Quick
Links
Past Charts
Home » Viridian Capital Chart of the Week: How Does Liquidity and Market Cap. Impact Valuation Metrics?
Chart of the Week
Chart of the Week
The Viridian Capital Chart of the Week highlights key investment, valuation and M&A trends taken from that week’s Deal Tracker that we believe are impactful for investors, companies and acquirers.
Week ended 04/26/2024
Viridian Capital Chart of the Week: How Does Liquidity and Market Cap. Impact Valuation Metrics?
- This week’s Chart of the Week explores the relationship between market cap., liquidity, and valuation.
- In the current capital-constrained environment, a logical hypothesis would be that valuation metrics should be higher for companies with more robust liquidity, as they have less apparent need for near-term capital raises. Similarly, the Valuation Gap graph in the Viridian Deal Tracker shows that larger cap companies consistently trade at high valuation multiples.
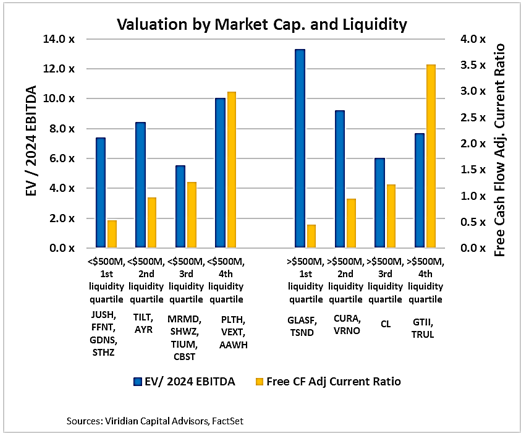
- Viridian broke the twenty analyst-covered U.S. Cultivation and retail companies into those with less than $500M market cap on the left and those with more than $500M market cap on the right. We then further separated the companies in each size group into quartiles based on Viridian’s free cash flow adjusted current ratio, which modifies the standard current ratio to account for annualized free cash flow.
- The blue bars (measured on the left axis) show median Enterprise Value/consensus 2024 EBITDA estimates. The yellow bars (measured on the right axis) show the median liquidity ratio.
- As expected, the median EV/EBITDA ratio for the larger companies on the right was 8.86x, approximately 270 bp above the 6.16x multiple of the smaller companies.
- Our intuition for the positive relationship between liquidity and valuation proves true for the under $500M group. The relationship is not perfect, but valuation ratios do rise as liquidity improves.
- The relationship, however, is reversed in the larger cap group, with valuation metrics trending downward as liquidity increases. We found a similar reversal when we last explored this topic in the Viridian Chart of the Week on January 24, 2021. At that time, valuations were close to all-time highs; the large-cap group was trading at over 20x NTM EBITDA with unprecedented access to capital.
- Why has the relationship not changed to reflect today’s capital constraints and lower valuations?
- Perhaps the smaller cap group is more dependent on balance sheet liquidity, whereas the larger caps are still viewed as having sufficient financing availability.
- Perhaps the four-fold complex of potential catalysts (rescheduling, SAFER, BOIES, and Garland memo has convinced the market that Something is bound to happen.
- Perhaps positioning in states likely to turn Rec trumps liquidity as a valuation consideration?
- Investors should continue to monitor the relatively tight liquidity exhibited by many of the companies on the graph.