OUR 9TH YEAR OF PROVIDING PROPRIETARY CAPITAL MARKETS INTELLIGENCE ON THE CANNABIS / HEMP / PSYCHEDELIC SECTORS
Quick
Links
Past Charts
Home » Viridian Capital Chart of the Week: Has Trading Liquidity Improved for Cannabis Stocks?
Chart of the Week
Chart of the Week
The Viridian Capital Chart of the Week highlights key investment, valuation and M&A trends taken from that week’s Deal Tracker that we believe are impactful for investors, companies and acquirers.
Week ended 01/19/2024
Viridian Capital Chart of the Week: Has Trading Liquidity Improved for Cannabis Stocks?
- The release of the unredacted text of the HHS recommendation has spurred cannabis equity prices upward. The MSOS ETF has risen approximately 27% over the last month. But has the pricing strength been accompanied by greater absolute and relative trading volumes?
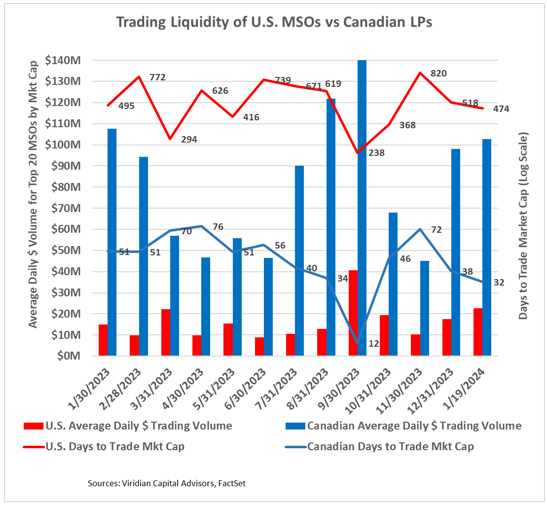
- The graph shows the aggregate average daily dollar trading volume of the top five U.S. MSOs by market cap (red bars) and the top five Canadian LPs (blue bars). In each case, we added the volume from the primary and secondary exchanges. The U.S. group trades more volume on the OTC than on the CSE. The Canadian LPs trade most of their volume on the Nasdaq with the CSE as the secondary exchange.
- The solid red line shows the U.S. Days to Trade Market Cap (DTTMC), while the solid blue line shows this statistic for the Canadian LPs. Days to Trade Market Cap is our preferred stock liquidity measure, calculated by Market cap divided by average daily dollar trading volume and represents the number of days it would take to trade the entire market cap of the stock.
- The average daily dollar trading volume for the U.S. MSOs was $21M for January to date, up from an average for the period of 16, but not as high as the $41M registered in September after the HHS announcement. Similarly, the days-to-trade value of 474 days is lower (better) than the average of 542 days for the entire period but far from the 238 days recorded in September.
- To understand how relatively illiquid the top MSOs are, consider that if an investor took a 5% position in a stock with a 474 DTTMC, they would need approximately 95 days to trade out of their position, assuming that they wanted to represent less than 25% of the average daily trading volume in the stock. This illiquidity is a considerable impediment to attracting institutional investors. The equivalent figure for the Canadian LPs is six days.
- The aggregate market cap of the Canadian LPs in the chart, at $3.3B, is only 31% of the $10.7B figure for the U.S. MSOs, and yet the Canadian average daily volume is 4.5x as high as their U.S. counterparts.
- Will rescheduling allow for uplisting to Nasdaq to begin to cure this issue? Sadly, our view is that rescheduling by itself will not be enough. Cannabis will remain federally illegal. No law prevents the Nasdaq from allowing U.S. cannabis listings. Still, we believe it will take a combination of rescheduling, SAFER, and a Garland memo to get the ball rolling on uplisting.
- Meanwhile, it is a classic chicken and egg conundrum. Institutional investors won’t come in, given the lack of liquidity, but the liquidity won’t get better until a pool of new capital enters the market.