OUR 9TH YEAR OF PROVIDING PROPRIETARY CAPITAL MARKETS INTELLIGENCE ON THE CANNABIS / HEMP / PSYCHEDELIC SECTORS
Quick
Links
Past Charts
Home » Viridian Capital Chart of the Week: Does the Lack of Trading Liquidity Inhibit Capital Raising?
Chart of the Week
Chart of the Week
The Viridian Capital Chart of the Week highlights key investment, valuation and M&A trends taken from that week’s Deal Tracker that we believe are impactful for investors, companies and acquirers.
Week ended 05/26/2023
Viridian Capital Chart of the Week: Does the Lack of Trading Liquidity Inhibit Capital Raising?
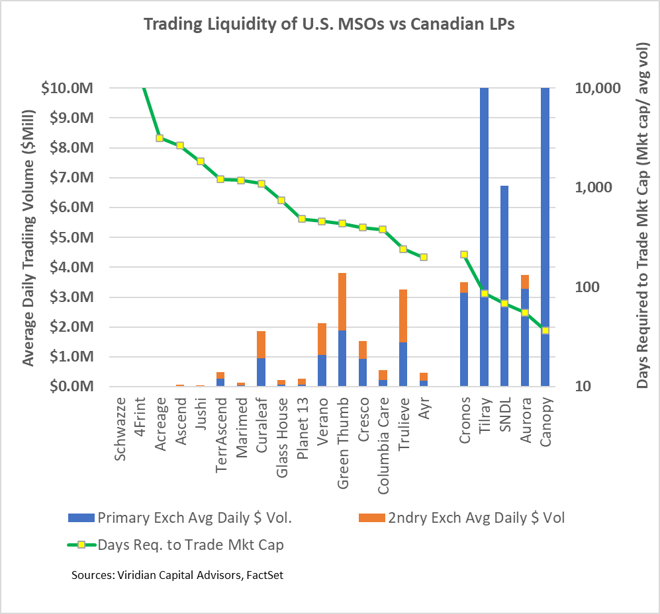
- The graphs’ bars show the average daily dollar trading volume for sixteen of the largest U.S. MSOs and five of the largest Canadian LPs from 1/1/23 through 5/19/23.
- The blue bars represent the volume on the primary exchange, while the orange bars depict the volume on the secondary exchange. Note: both Tilray (TLRY: Nasdaq) and Canopy Growth (CGC: Nasdaq) have higher trading volume than shown on the graph at $17.5M and $17.6M, respectively.
- Investors incorrectly assume that most U.S. companies trade primarily on Canadian exchanges. However, eleven U.S. companies have higher volumes on the OTC than on the Canadian exchanges. Only Jushi (JUSH: CSE)(JUSHF: OTCQX), TerrAscend (TER: CSE)(TRSSF:OTCQX), Curaleaf (CURA: CSE)(CURLF: OTCQX), Verano (VRNO: CSE)(VRNOF: OTCQX), and Cresco (CL: CSE)(CRLBF: OTCQX) actually trade more on the CSE.
- The green line on the chart shows the market cap divided by the average dollar volume or the days required to trade the company’s market cap. This measure puts trading volume on a common scale that normalizes for the significant scale differences between the companies.
- The largest dollar volume U.S. traders, Green Thumb (GTII: CSE)(GTBIF: OTCQX), and Trulieve (TRUL: CSE)(TCNNF: OTCQX) trade between $3M and $4M per day, similar to the lowest volume Canadian traders Cronos (CRON: Nasdaq)(CRON: TSX) and Aurora (ACB: Nasdaq)(ACB: TSX). However, Green Thumb and Trulieve would require 435 and 242 days, respectively, to trade their market caps, whereas Cronos and Aurora would require only 212 and 56 days, respectively.
- At 200 days to trade its market cap, AYR Wellness is the lowest U.S. company, similar to Cronos, but over twice as many days as any other Canadian company.
- Why does trading liquidity matter for capital formation?
- Imagine you are an investor contemplating investing $100M in a U.S. company with an average volume of around $1M daily. You must consider that it would take you nearly five months to liquidate your position without causing a spike in volume that would likely pressure the stock price. That same $100M invested in Canopy Growth would only take six days to trade out of. Most of the U.S. companies on the graph are better investments in our view than Canopy Growth; however, the tremendous illiquidity of these stocks would have to give us pause.
- Trading liquidity inhibits capital formation because institutional investors do not want to be locked into their investments with no ability to trade or exit. Significantly increased liquidity through up-listing to senior exchanges would attract incremental institutional investment that will not come into cannabis otherwise.
- We believe that the SAFE Act would eventually lead to up-listing possibilities as banks become emboldened to custody stocks and trading liquidity rises to the point that Nasdaq notices. The effect, however, is indirect and longer term. Nothing about the SAFE Act as filed moves the needle on up-listing.
- TerrAscend is the pioneer in attempting to achieve TSX listing, and while the TSX is not Nasdaq, this could be an important start that, if successful, will spur follow-on interest. Meanwhile, the industry should focus on the regulatory changes that matter: 280e reform and up-listing, changes that would dwarf the impact of the SAFE Act for the companies on this chart.