OUR 9TH YEAR OF PROVIDING PROPRIETARY CAPITAL MARKETS INTELLIGENCE ON THE CANNABIS / HEMP / PSYCHEDELIC SECTORS
Quick
Links
Past Charts
Home » Viridian Capital Chart of the Week: Does Higher Capital Intensity Pay Off in Cannabis?
Chart of the Week
Chart of the Week
The Viridian Capital Chart of the Week highlights key investment, valuation and M&A trends taken from that week’s Deal Tracker that we believe are impactful for investors, companies and acquirers.
Week ended 05/24/2024
Viridian Capital Chart of the Week: Does Higher Capital Intensity Pay Off in Cannabis?
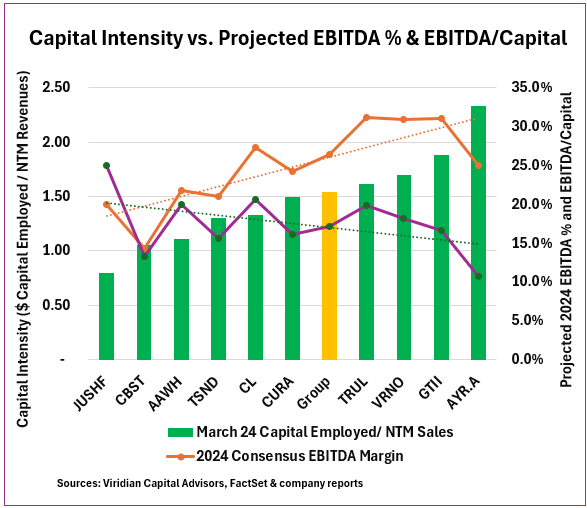
- The Viridian Chart of the Week on 8/27/23 demonstrated that cannabis is more capital-intensive than tobacco, alcohol, pharmaceuticals, or general consumer products. Cannabis measured 1.67x capital/sales. The industry has managed to reduce capital intensity slightly since then, and the group now measures 1.54x capital/sales.
- The high capital intensity has severe implications for internally fundable growth. If, on average, it takes $1.54 of extra capital to get $1 of additional sales, with 30% EBITDA margins and high 280e taxes, it is clear that growth requires external financing. S3 will help but not eliminate this issue.
- This week’s chart explores the differences between major MSOs in capital intensity and the implications for EBITDA margins and EBITDA/ Capital employed.
- The green bars on the chart show each company’s March 2024 Capital employed (book equity+ book debt-cash) divided by its projected next twelve-month sales. Note the significant discrepancy between the least capital-intensive competitor, Jushi (JUSHF: OTCQX) vs. the most capital-intensive AYR Wellness (AYR.A: CSE). Jushi has only $.80 of capital for each dollar of sales, whereas AYR has $2.33 of capital for each dollar of sales.
- The orange line shows each company’s projected 2024 EBITDA. Higher capital intensity tends to correlate with higher EBITDA margins. This effect is probably due to margin increases achievable from vertical integration, but secondarily, it is due to the cost savings of greater process automation.
- There are several outliers in this distribution. Jushi has better-projected margins than its low capital intensity would predict. Perhaps Jushi will have to spend more to achieve the revenues and EBITDA that analysts are projecting. AYR is another anomaly in that its 25% projected EBITDA multiple is lower than the dotted regression line suggests. AYR has invested significant amounts in Ohio and Florida in anticipation of adult rec roll-outs, potentially understating returns on capital.
- The purple line on the chart shows EBITDA/Capital Employed, which is unlevered pretax return on capital. The downward trend in the data suggests that while greater capital intensity enables higher EBITDA multiples, it may not pay off with regard to return on investment. Jushi, with the second-lowest projected 2024 EBITDA margin, has the highest EBITDA/ Capital of the group.
- In the long run, interstate commerce will mitigate the issue of capital intensity inhibiting internally fundable growth. The ability to centralize operations with regional grow centers and consolidate other operating functions will reduce the capital intensity of the industry and foster better capital returns. IC is still years away, however, and in the meantime, investors should be watchful of the capital intensity of the companies they invest in to make sure the growth opportunities justify the capital outlays.