OUR 9TH YEAR OF PROVIDING PROPRIETARY CAPITAL MARKETS INTELLIGENCE ON THE CANNABIS / HEMP / PSYCHEDELIC SECTORS
Quick
Links
Past Charts
Home » Viridian Capital Chart of the Week: Do the Relative Valuations of Cannabis Lenders Make Sense?
Chart of the Week
Chart of the Week
The Viridian Capital Chart of the Week highlights key investment, valuation and M&A trends taken from that week’s Deal Tracker that we believe are impactful for investors, companies and acquirers.
Week ended 04/07/2023
Viridian Capital Chart of the Week: Do the Relative Valuations of Cannabis Lenders Make Sense?
-
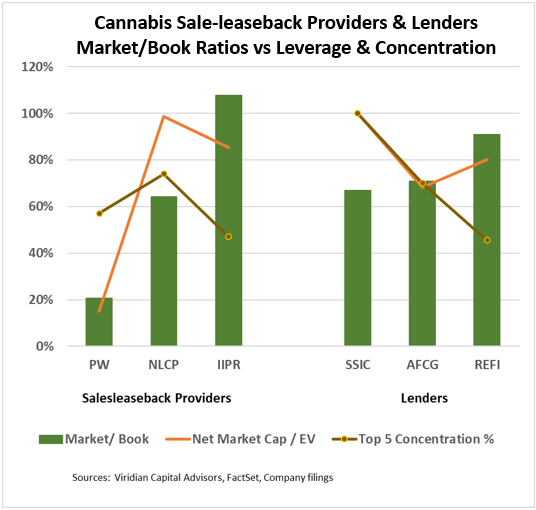
- The graph shows the market/book ratios for cannabis sales leaseback providers and lenders, along with two indicators of risk: market leverage and borrower concentration.
-
- The green bars show market/book ratios for each company. The orange line shows the market cap minus cash divided by enterprise value. NewLake Capital (NLCP: OTCQX) and Silver Spike Inv. (SSIC: Nasdaq) have virtually no debt, while PowerReit (PW: Nasdaq) has an equity market value of only 15% of enterprise value. The brown line shows the total concentration of the top 5 tenants or borrowers.
-
- The companies trade at a wide range of market/book ratios. PW is the outlier at .2x book value, which seems high considering that of its 19 cannabis greenhouses, 11 are vacant, 14 are non-current or in default, and impairments have been taken on all 19.
-
- The comparison between NLCP and IIPR is more interesting. IIPR is the only company on the graph trading above book value. NLCP is significantly less levered; however, 74% of its 2022 rental revenue was attributable to its top 5 tenants vs. only 47% for IIPR. IIPR has three properties representing 6.3% of 2022 revenues in default vs. one property representing 10.6% of revenues for NLCP. IIPR, however, also had to take possession of 3 properties from Kings Garden, including one it is trying to re-lease for non-cannabis use. IIPR has an average of $267 per square ft invested in its properties, slightly higher than the $258 for NLCP. Both values concern us because we believe non-cannabis uses would garner significantly lower valuations. We conclude that the gap is too large, IIPR should not be trading above book value given the risks it faces, and NLCP deserves a somewhat higher valuation.
-
- In the lender group, REFI trades at .91x book, well above the .71x of AFC Gamma (AFCG: Nasdaq). REFI’s valuation appears full, but the premium to AFCG seems justified by REFI’s significantly lower leverage, lower borrower concentration, and the fact that REFI has only 1.2% of Current Expected Credit Loss (CECL) compared to 5.0% for AFCG. Silver Spike (SSIC: Nasdaq) trades at the lender group’s lowest multiple of book value. This discount is probably attributable to its high borrower concentration, with two relatively low-yielding loans making up 80% of the portfolio.
-
- The companies on this chart have been vital suppliers of debt capital to a cannabis market where equity investment has all but dried up. Given the challenging environment for their borrowers, however, it seems inevitable that the group will take more hits in 2023.