OUR 9TH YEAR OF PROVIDING PROPRIETARY CAPITAL MARKETS INTELLIGENCE ON THE CANNABIS / HEMP / PSYCHEDELIC SECTORS
Quick
Links
Past Charts
Home » Viridian Capital Chart of the Week: Credit Statistics that Inform Financing Options
Chart of the Week
Chart of the Week
The Viridian Capital Chart of the Week highlights key investment, valuation and M&A trends taken from that week’s Deal Tracker that we believe are impactful for investors, companies and acquirers.
Week ended 02/09/2024
Viridian Capital Chart of the Week: Credit Statistics that Inform Financing Options
- Despite the considerable advance in equity prices in anticipation of a DEA rescheduling announcement, little has changed in the overall financing environment. The overall tone feels better, but there hasn’t been much of an influx of new investors. Six weeks into 2024, capital raises lag behind 2023, the lowest year in recent memory.
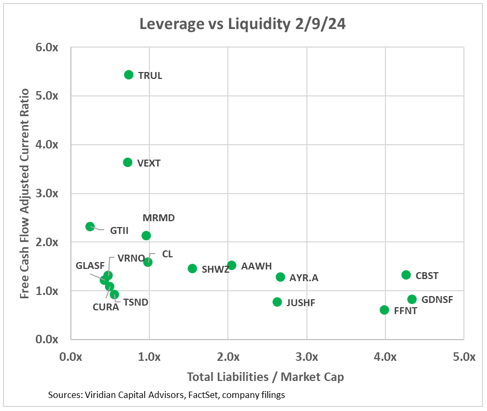
- The chart shows sixteen of the largest MSOs with two variables that inform the financing choices available for each.
- Free cash flow adjusted current ratio, measured on the vertical axis, is a bespoke liquidity measure used in the Viridian Credit Tracker scoring model. It augments the standard current t by adding annualized free cash flow to the numerator. Values below one indicate a likely need to raise capital during the year.
- Total Liabilities/Market Cap, plotted on the horizontal axis, is the highest weighted leverage indicator in the Viridian Credit Tracker credit scoring model. Market cap is the equity market’s direct measure of a company’s “cushion “between the value of its assets and its liabilities. Unlike more traditional leverage indicators like Debt/ EBITDA, the measure reacts instantly to changes in equity price and implicitly considers the market’s view of the company’s future operating results.
- Companies like Goodness Growth (GDNS: CSE), 4Front (FFNT: CSE), and Cannabist (CBST: NEO), with unsustainably high leverage and potential liquidity pressures, have the most difficult choices. Debt options will likely include painful equity kickers, while equity options may be unavailable or highly dilutive. Debt-to-equity swaps or asset sales may be the most attractive options.
- Companies in the middle leverage tier, Including Schwazze (SHWZ: CSE), Ascend (AAWH: OTCQX), AYR (AYR.A: CSE) and Jushi (JUSHF: CSE) have more options. Jushi appears to have the most liquidity pressure and the highest EV/EBITDA of the four. Positive developments in Pennsylvania or Virginia might allow the company to issue equity. The others should be preparing to issue equity or convert debt whenever positive catalysts like a DEA announcement hit. Recent transactions by AYR and 4Front indicate that repairing balance sheets may be painful, though necessary.
- Companies with low market leverage (<1x) have additional options. Curaleaf (CURA: CSE) and TerrAscenc (TSND: TSX) have low liquidity but have low market leverage and trade at high EV/ 2024 EBITDA multiples. They should consider “averaging up” by doing small equity issues and following with additional equity on upside catalysts.
- Green Thumb (GTII: CSE) and Verano (VRNO: NEO) have low market leverage and less than 2X adj net debt/ EBITDA. They have solid liquidity and are not pressured to raise capital. Their conservative leverage makes it possible that in a post-280e world, they might benefit from incurring more debt.
- Investors can better understand the financing choices available to MSOs through the simple two-dimensional lens presented here. The Viridian Deal Tracker online contains weekly updates of this and other valuable visualizations.