The Viridian Capital Chart of the Week highlights key investment, valuation and M&A trends taken from that week’s Deal Tracker that we believe are impactful for investors, companies and acquirers.
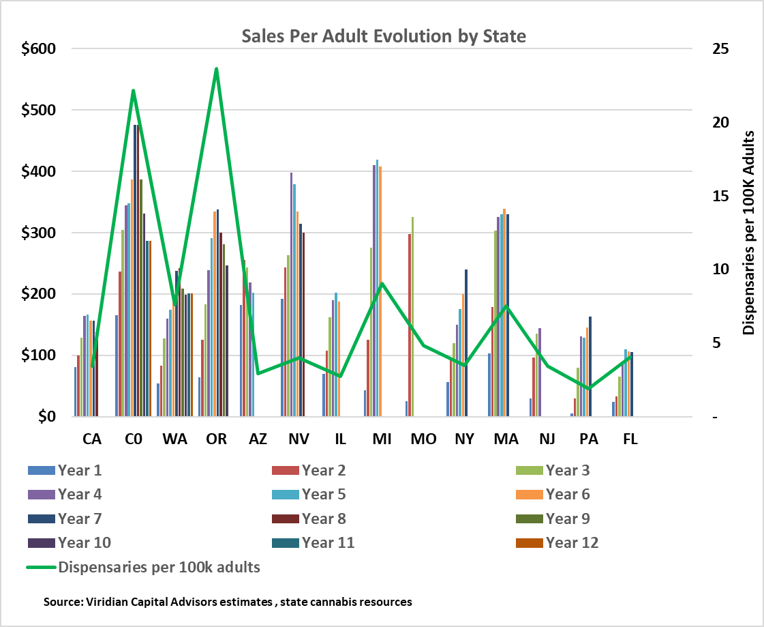
- The Viridian Chart of the Week looks at the evolution of total retail sales per adult (both medical and Adult Recreational) over time. The far-rightmost bar for each state represents our 2025 estimates. Some states, like California, have had recreational markets for over a decade, while others, like New York and New Jersey, have less than a 5-year track record.
- We added Pennsylvania and Florida on the right to put the impact on legal sales into context when a state goes recreational.
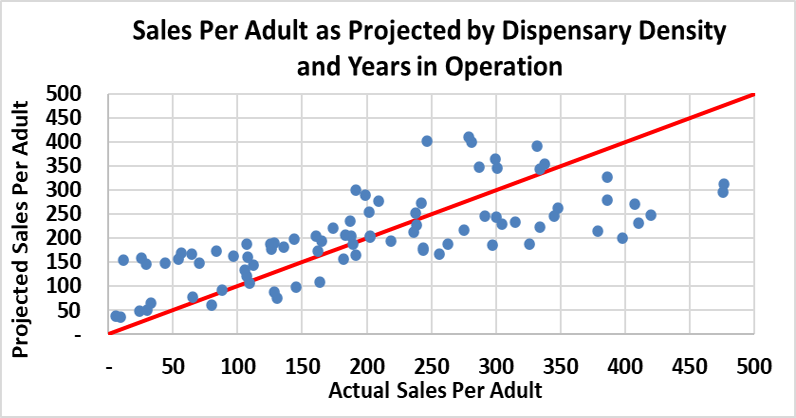
- The scatterplot on the bottom left represents the results of a simple statistical model where we project sales per adult using three variables: # of dispensaries per 100,000 adults, years in operation, and a dummy variable indicating adult vs. medical market. The regression has an R-squared of around 60% with all three variables statistically significant. Accordingly, this simple regression does a reasonable job of projecting the growth of adult sales.
- The regression shows that one thing states can do is incentivize municipalities to opt in to retail cannabis. One of the key issues facing two of the largest states, New York and California, is that much of each state is a “cannabis desert” where a large percentage of the municipalities have opted out. The classic case of this is New York’s Long Island, a highly populated, demographically favorable area for cannabis sales, but with few participating municipalities.
- What else accounts for the difference in cannabis sales per state? We find three other variables make up a significant part of the difference between actuals and predicted sales per adult:
- Cross-border and tourist traffic. Some states, like Colorado and Nevada, gain significant sales from tourists, whose numbers are not accounted for in their population totals. Our earlier work indicates that these states may be seeing over 30% of retail sales from non-residents. Other States, like Michigan and New Mexico, may be seeing similar percentages of their total sales accounted for by non-residents crossing the border to purchase there due to much lower prices.
- The degree to which Illicit THC and intoxicating hemp products substitute for legal purchases. Clearly, this is a major factor in California and New York, though the state has recently begun to aggressively crack down. Other States, like Colorado, seem to have done a much better job of integrating illicit markets. Similarly, we estimated that hemp products could be up to $15B of sales drained from the legal market.
- Encouraging dispensary formation. Some states have experienced delays in their social equity programs, resulting in slower dispensary rollouts.
- Overall, the central tendency seems to be that over time, and accounting for the factors above, states have gravitated towards around $300 per adult in spending. As states begin to foster dispensary growth by incentivizing municipal opt-ins, become more aggressive at combating illicit and soon-to-be-illegal intoxicating hemp sales, and continue to roll out new medical programs, the trajectory of cannabis retail sales can materially improve from the weak results we saw in 2025. Pennsylvania, Florida, and Virginia, if they turn to adult recreational use, could provide a 10%+ boost to total retail sales on their own.
- Investors should look beyond the slow growth of 2025, as the above factors suggest a high single-digit compounded growth rate over the next five years is still a strong possibility