OUR 9TH YEAR OF PROVIDING PROPRIETARY CAPITAL MARKETS INTELLIGENCE ON THE CANNABIS / HEMP / PSYCHEDELIC SECTORS
Each week, Viridian publishes insights and analysis on completed capital raise transactions in the prior week, focusing on all equity and debt deals. Our analysis includes:
- Summary
- Outlook
- Best & Worst Perfromers
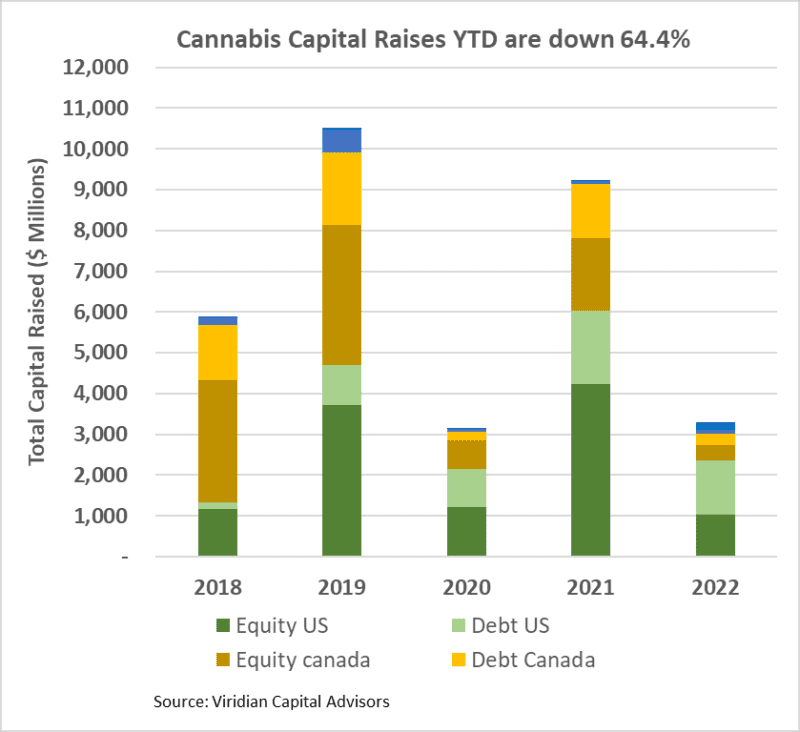
Cannabis capital raises are off 63.9% YTD
- Total Equity issuance is off 74.4%, and total debt issuance is down 43.9%.
- U.S. debt is down only 27.6%, while Canadian debt is down a more significant 78.3%.
- At 53.7% of total capital raised, debt remains the highest in history for comparable periods.
- Public companies accounted for 73.9% of total financing YTD, down from 83.2% in 2021.
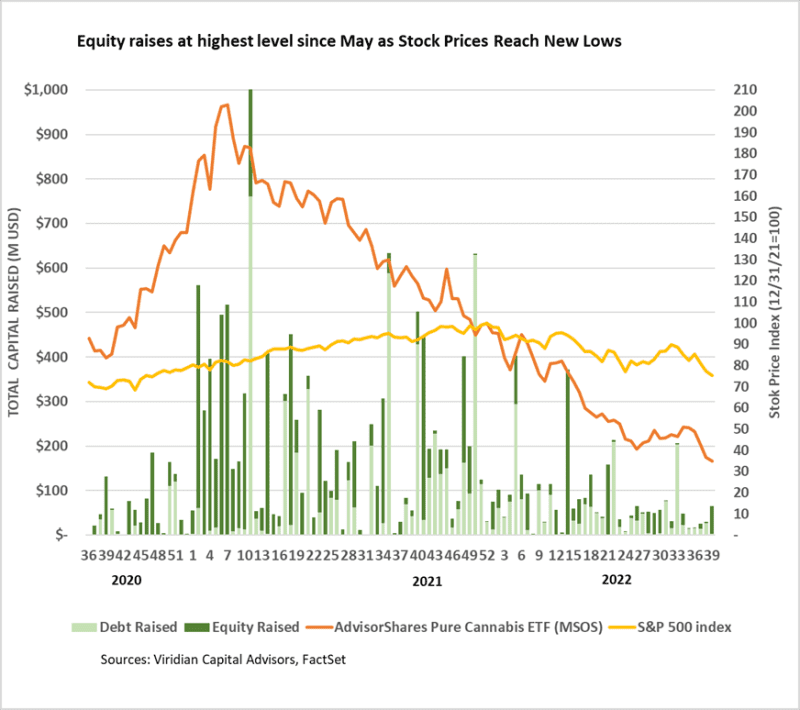
- The graph below shows that U.S. activity dominated capital raises for the first thirty-eight weeks of 2022, with 71.2% of all capital raised.
The U.S. Cultivation & Retail sector has experienced a sharper change in capital raise activity:
- Total capital raised is down 67.2%, but equity capital raised is down approximately 96%
- Debt financing is down 24.2% YTD and accounts for approximately 93% of all capital raised; private companies raised a record 35% of it.
- 62.8% of total capital raises YTD were completed by public companies compared to 79.5% in 2021
- In 2022, there have been no equity deals above $25M!


YTD Returns by Public Company Category
- U.S. Tier 1 companies improved one notch relative to the U.S. Non-Plant-Touching group to become the third worst performing group YTD.

- The market is strongly differentiating between MSOs. In two months, there has been a 60-point difference between the percentage returns of the best performing versus the worst performing MSO. The chart below shows the divergence of stock prices since the end of July.

Best and Worst Performers of the last week and YTD
- Tilt Holdings (TLT: CSE) was the week’s best performer, with a 21.2% increase on news that it had extended the investigational period on its pending sales-leaseback deal with IIPR until November. Management expects to be able to resolve all issues with the Pennsylvania Department of Environmental Protection by then, allowing the transaction to close.
- The four biggest losers of the week all have a commonality: California. VIBE (VIBE: CSE) and MedMen (MMEN: CSE) were both down 17.6%; Unrivaled (UNRV: OTC) was down 20.2%, and StateHouse fell by 39.9%.

