OUR 9TH YEAR OF PROVIDING PROPRIETARY CAPITAL MARKETS INTELLIGENCE ON THE CANNABIS / HEMP / PSYCHEDELIC SECTORS
Each week, Viridian publishes insights and analysis on completed capital raise transactions in the prior week, focusing on all equity and debt deals. Our analysis includes:
- Summary
- Outlook
- Best & Worst Perfromers
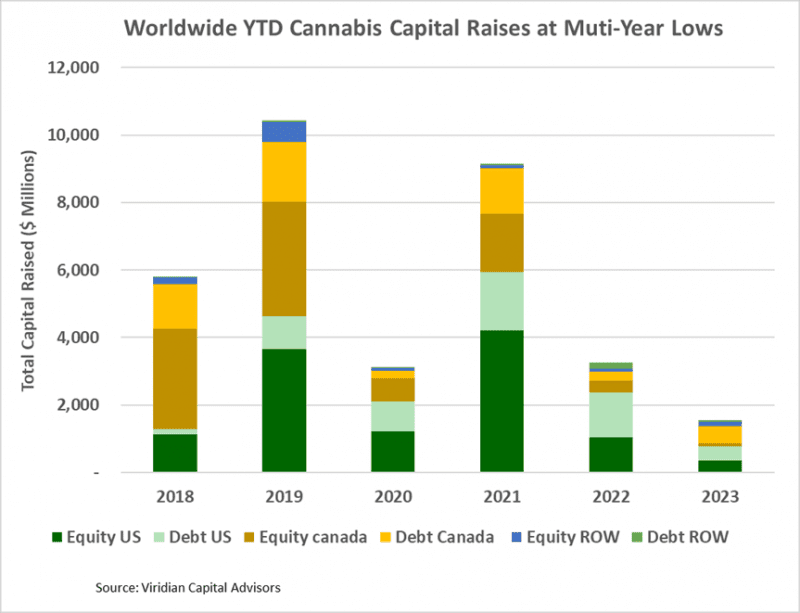
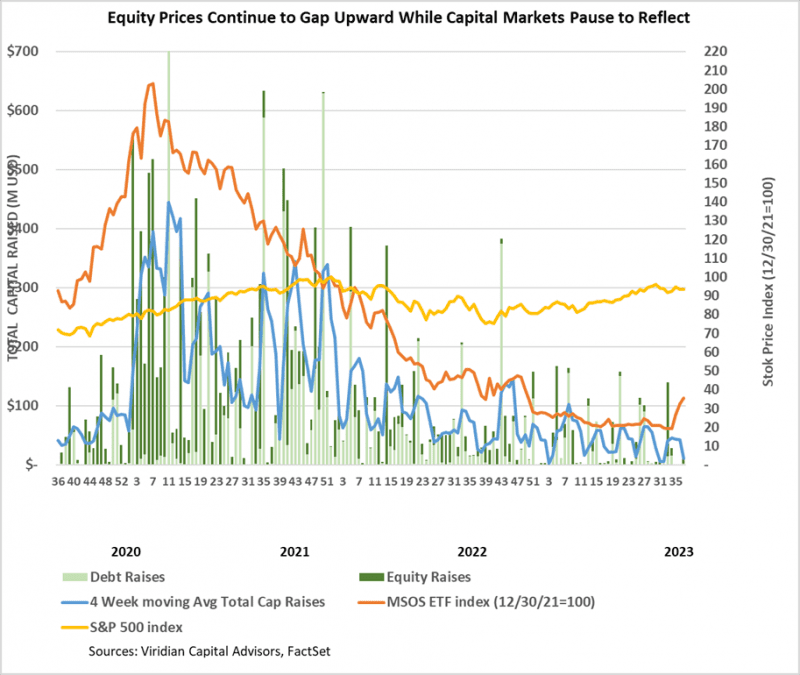
- Cannabis capital raises are off to a multi-year low. Only $1.56B closed through the first thirty-seven weeks of the year compared to $3.26B last year.
- Debt represents 62.7% of total capital raised, significantly higher than in any other comparable period since 2018.
- Public companies have raised 72.6% of total capital YTD, down from 74.8% last year and lower than any comparable period since 2019.
- International raises accounted for 12.5% of the total, the most significant percentage since before 2018.
VIRIDIAN INSIGHTS
- Reschedule, Reschedule, Reschedule!
- The HHS recommendation to reschedule cannabis to Schedule 3 has dramatically impacted cannabis equity prices.
- The MSOS ETF is up 85% from before the rescheduling news. The chart below shows enterprise to next-twelve-month valuation multiples now compared to previous times when positive regulatory/legislative news hit.

-
- Although multiples have rebounded to close to the levels seen for the 5th or 7th SAFE Act passage in the House, the rescheduling news is more significant as it dramatically impacts cash flows. We conclude that there is significantly more multiple expansion potential to come. If valuations multiples rose to where they were after the announcement of the Schumer-Booker bill, the incremental gains could exceed 63%.
- The potential additional gains also pose an increased risk. If the DEA does not follow the Schedule 3 recommendation, cannabis prices could drop to new lows. Although sheepish, we believe “things are different this time.” Simultaneous progress on 280e and the SAFE Act has never happened before, and we believe the benefits of these two acts together would exceed the benefits of the Schumer/Booker proposal from July 2021. On a down note, interest rates are significantly higher than they were in 2021, and industry economics is more challenging.
- There is still substantial uncertainty about the likelihood, timing, and potential impacts of rescheduling, and we will continue to update the summary below as we learn more:
- Likelihood:
- There is a high likelihood that the DEA agrees to reschedule cannabis to level III.
- The DEA has historically never overridden scheduling recommendations from the HHS.
- The most plausible reason for the DEA refusing the HHS recommendation is that cannabis is subject to control under the Single Convention on Narcotic Drugs of 1961, and rescheduling to lower than level two would not assure compliance with this treaty. Notably, the failure to prevent states from licensing adult-use cannabis put the U.S. in violation of the treaty. No matter the DEA’s position, it cannot bring the country back into compliance with the treaty. Still, this remains the most significant potential sticking point.
- Timing:
- Our best guess is rescheduling is unlikely to occur before Q2:2024.
- In developing scheduling evaluations, DEA must consider and evaluate eight statutory factors:
- Actual or relative potential for abuse.
- Scientific evidence of the pharmacological effects and general pharmacology of the drug or other substance.
- The state of current scientific knowledge regarding the drug or other substance.
- Its history and current pattern of abuse.
- The scope, duration, and significance of abuse.
- What, if any, risk there is to the public health?
- Its psychic or physiological dependence liability.
- Whether the substance is an immediate precursor of a substance already controlled.
- In developing scheduling evaluations, DEA must consider and evaluate eight statutory factors:
-
-
- Once it has done its analysis, the DEA will post its recommendations and analysis to the Federal Register for public review. It will also open a 60-day public comment period. Interested parties may request a hearing before a federal administrative law judge to present other evidence or to object to the proposed rule.
- Impacts– Two definite rescheduling results are the removal of 280e and the fostering of cannabis research.
- The removal of 280e would have a dramatic financial impact on plant-touching companies.
- The table below demonstrates that for a hypothetical cannabis company with 50% gross margins, 20% SG&A, and 3x Debt/ EBITDA, 280e can result in effective tax rates (on pretax income) of over 100%. The table demonstrates our previous claim that debt/EBITDA over three times is unsustainable in a 280e world, as the calculated payback period for the debt would be an unacceptable 12.26 years. Cannabis companies under 280e need less than 2x debt/EBITDA to have acceptable 5-year payback periods.
- The table shows that combined effective rates (depending on state tax rates) would be reduced to around 27% without 280e making a huge difference in debt capacity. Without 280e, companies could comfortably carry 3x leverage with acceptable payback periods. Importantly, by making interest expense tax deductible, the elimination of 280e also reduces the cannabis cost of capital and increases the intrinsic value of the firms.
-

-
-
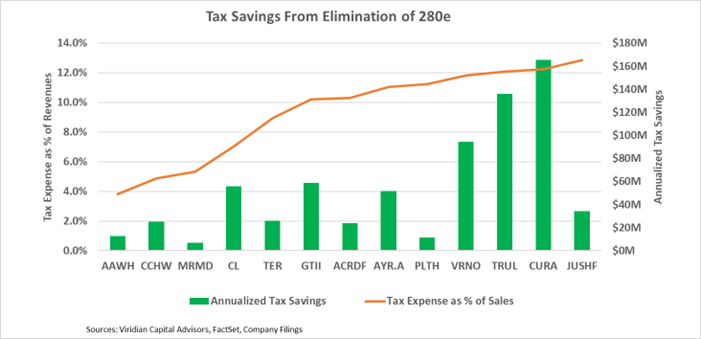
- Our Chart of the Week, reproduced below, shows an annualized tax savings of about $700M for a group of top 13 MSOs.
-
-
-
- Rescheduling will also spur cannabis research by reducing licensing requirements. Over time, this should accelerate medical product creation, providing significant patient benefits.
- What would NOT change:
- Rescheduling should not be confused with legalization. Cannabis as a Schedule 3 substance will continue to be federally illegal, which has several important implications:
- Uplisting to Nasdaq is not assured. Nasdaq is reportedly studying its policies concerning Schedule 3. It may require the SAFE Act to push them over the line.
- The SAFE Act would also probably be necessary to remove restrictions on credit card usage in dispensaries since state-legal adult-use dispensaries will still be violating federal law.
- Significant increases in institutional capital may occur with Schedule 3 status; however, institutions that are concerned with federal illegality may not gain sufficient comfort from Schedule 3
- Rescheduling will not give cannabis companies access to Chapter 11 bankruptcy proceedings as the business will remain federally illegal.
- Potential pitfalls
- Increased role of FDA. While cannabis is Schedule 1, regulating the industry falls primarily to the DEA. Rescheduling to 3 will potentially increase the role of the FDA. While we have no reason to believe the FDA will feel empowered to begin more aggressively regulating the industry (especially since it will receive no new funding), it is a risk.
- The importance of a new “Cole memo” or Garland memo, which would explicitly draw limits on federal enforcement against state legal business, would be heightened. We expect such a memo will be forthcoming.
- Rescheduling should not be confused with legalization. Cannabis as a Schedule 3 substance will continue to be federally illegal, which has several important implications:
-
- SAFE is Back!
- The Senate Banking Committee has officially scheduled a vote on cannabis banking reform (the SAFE Banking Act). A decisive vote in the committee will help build momentum for the full Senate and House votes.
- This year, there appear to be sufficient votes in the Senate from both sides of the aisle to pass the bill. The drama may be on the House side.
- It will be instructive to see whether a stand-alone bill will be voted on. We believe any attempt at a “shell game” of trying to insert the bill inside other legislation will be treated harshly by the market. Too much déjà vu!
- Re-equitization is in the air.
- On September 18, 2023, Columbia Care (CCHW: NEO)(CCHWF: OTCQX), the seventh largest U.S. MSO by market cap, announced that it had entered into a subscription agreement with institutional investors for the sale of 22.24M equity units of the company for aggregate gross proceeds of approximately $25M ($1.11 per share).
- Each unit has one common share and ½ of a three-year warrant with an exercised price of approximately $1.43 (premium of 29%). After subtracting the warrants’ value, The net share price was roughly $1.02, a 24% discount to its prior closing price.
- Investors have an option to purchase an additional $25M in additional units at the same price.
- Proceeds of the issue will be used to reduce indebtedness and for general corporate purposes.
- The company also entered into a non-binding agreement with the investors to repurchase up to $25M of their holdings of the 6% senior secured convertible notes due June 2025. The purchase price would be payable in common shares.
- This is precisely the kind of transaction we have been anticipating based on a bounce in stock prices, and we think this is just the first of what we expect to be a wave of such transactions. Before the completion of the transaction, Columbia ranked #18/25 on the Viridian Credit Tracker Credit Model due to its high leverage, low profitability, and barely adequate liquidity.
- Completing the announced transactions would have a meaningful but not curative impact on Columbia’s leverage. As of June 30, 2023, the company had a total debt of $556.1M, representing 4.93x consensus 2024 EBITDA estimates. We have shown that in a 280e world, debt/EBITDA of even 3x is unsustainable. Assuming that investors exercise their option to double the size of the deal to $50M and sell $25M of the 6% notes for equity, total debt would fall by approximately $75M. Debt/EBITDA would come down to 4.26x, still too high, in our view, even in a post-280e world. Look for more financial engineering moves to follow.
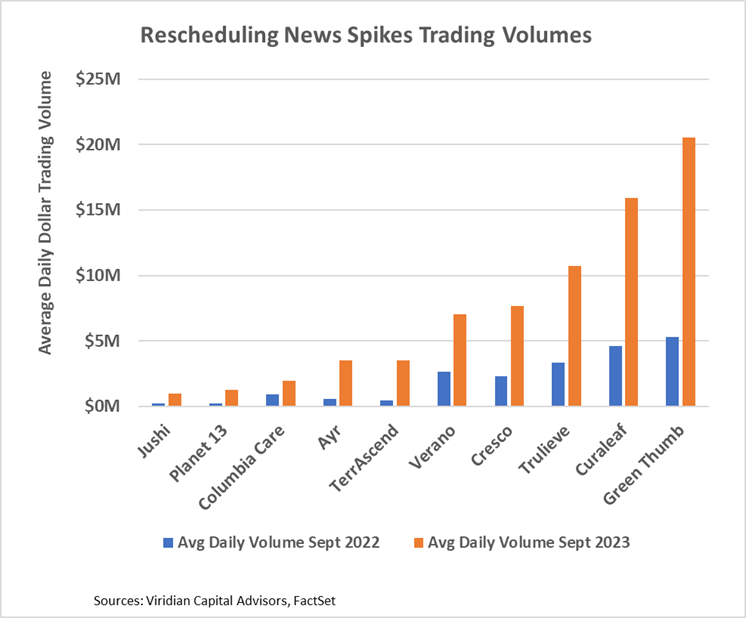
- Trading Volumes are Increasing
- The graph below compares the average daily dollar trading volume for the ten highest volume MSOs between 8/31/23 and 9/15/23 and the equivalent period in 2022. Average dollar volume is between 22% (4Front) and 664% (TerrAscend) higher. Green Thumb’s $20.5M exceeds all Canadian LPs except Canopy Growth ($35.4M) and Tilray ($73.1M).
- Analysts have not revised their slow growth estimates for the remainder of 2023 and 2024, waiting for more clarity about the fate of SAFE and rescheduling.
- The impact of the combination would be considerable, enabling higher revenues through credit card purchases, promoting higher internally financed growth rates, and fostering the revitalization of the cannabis capital markets.
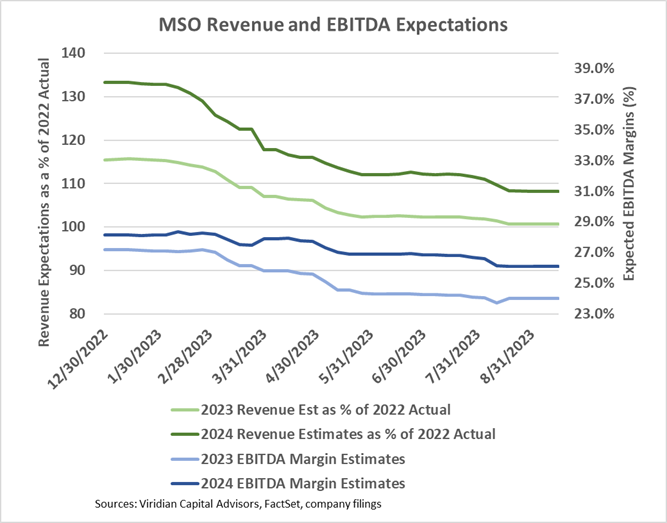
- The graph below shows consensus revenue and EBITDA estimates for the 10 top MSOs for 2023 and 2024. The light blue line at the bottom shows that 2023 consensus EBITDA margins are now 24.0%, down from the beginning of the year expectations of 27.2% and 2022 actual margins of 25.0%. 2024 margins, shown in the dark blue line, are now expected to be 26.1%
- The green lines at the top show that 2023 revenues are expected to be 1% higher than 2022, while 2024 revenues are expected to be 8% higher than 2022. The 3.9% CAGR is decidedly anemic and reflects ongoing wholesale price compression, somewhat offset by positive impacts of new adult rec states.
- Lower revenue and margin expectations are among the reasons we do not believe cannabis multiples are likely to fully retrace the path back to peaks of over 20x EV/ EBITDA.
- Amend and Extend
- Columbia Care (CCHW: NEO)(CCHWF: OTCQX) announced that it is in “continued discussions” with holders of its 13% senior secured notes due May 2024 to exchange their notes into the company’s 9.5% senior secured notes due February 2026 on a one-for-one basis.
- While this would doubtlessly aid Columbia’s marginal liquidity situation, we still don’t quite understand the deal’s economics. Trading from a higher coupon with a short maturity to a lower coupon with a longer maturity on a straight-up basis? How does that work? Perhaps one of our readers can explain?
- Canopy Growth (CGC: Nasdaq) New issue distressed equity or the first cannabis meme stock?
- On September 18, 2023, Canopy Growth announced that it had entered into subscription agreements with institutional investors to sell 22.9M units at $1.09 per unit for gross proceeds of $25M.
- Each unit consists of one common share and one five-year warrant exercisable at $1.35 per share (23.85% premium).
- Investors also received over-allotment options to purchase an additional 22.9M units at the same price.
- The five-year warrants are valued at approximately $0.28 per share, producing a net share price of $0.81, a 40% discount to the trading price before the announcement. Canopy’s share price has traded down by 23.7% since the announcement.
- We can’t blame the company for hitting this pocket of availability at prices that the U.S. rescheduling announcement has inexplicably boosted. The implied discount to previous trading levels might be painful, but the company’s ability to keep doing dilutive equity issues may be crucial to its survival.
- Still, was it only a week ago that Canopy walked away from a significant subsidiary (BioSteel), which immediately filed for bankruptcy?
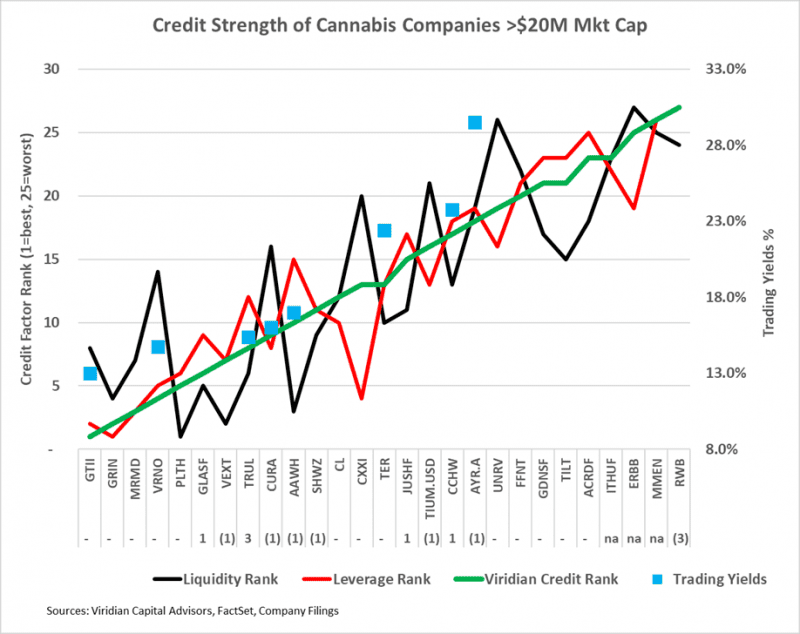
- The chart below shows our updated 9/15/23 credit rankings for the 27 U.S. cannabis companies with over $20M market cap. iAnthus (ITHUF: OTCQX), American Green (ERBB: OTC), and MedMen (MMEN: CSE) were added this week. The number below the ticker symbol indicates the change in credit ranking since last week, where a negative number suggests credit deterioration while a positive indicates improvement. We have also added offered side debt yields, which show a strong correlation to the Viridian Capital Credit rankings.
- Columbia Care (CCHW: NEO)(CCHWF: OTCQX) announced that it is in “continued discussions” with holders of its 13% senior secured notes due May 2024 to exchange their notes into the company’s 9.5% senior secured notes due February 2026 on a one-for-one basis.
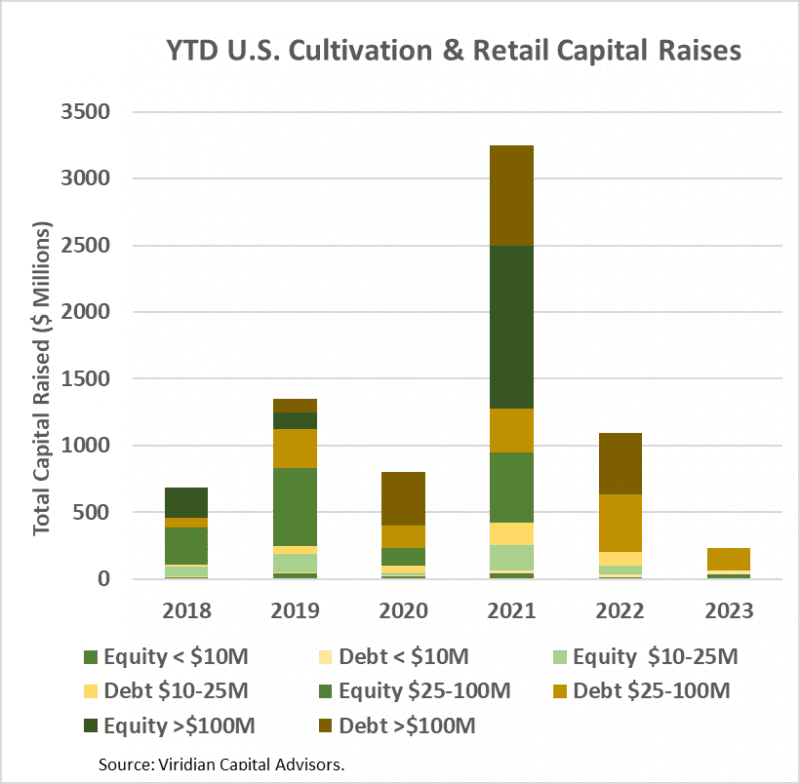
- YTD, U.S. Cultivation & Retail sector capital raises are down 78.4% from 2022 and are lower than any previous comparable period since before 2018.
- Debt is still the dominant form of funding, accounting for 86.4% of all cultivation sector capital raised. 14.9% of the debt raised YTD has been for private companies.
- Large transactions are still absent from the market. There have been no debt or equity deals over $100M YTD. The graph below shows the strikingly different composition of U.S. Cultivation & Retail capital raises in 2023 compared to previous years, with small equity and midsized debt dominating raises.
- Cannabis equities (as measured by the MSOS ETF) were up 9.28% for the week.
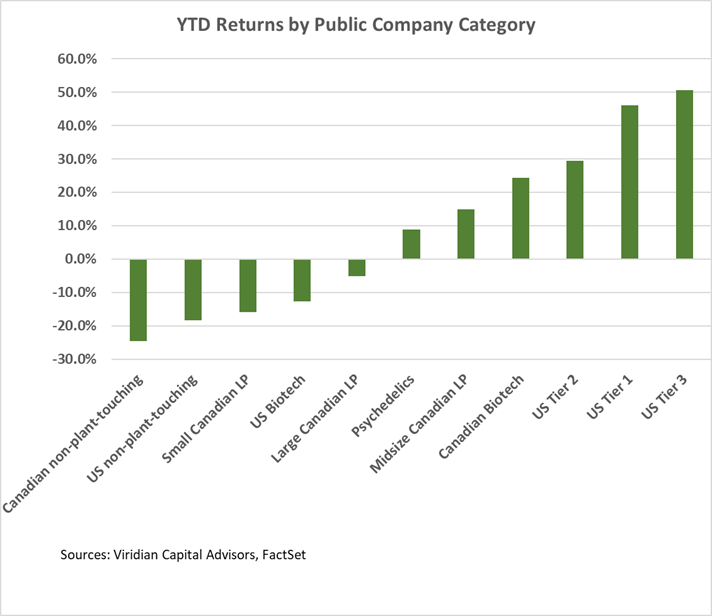
YTD Returns by Public Company Category:
- The rally since the rescheduling news has continued to make significant changes in the rankings of YTD returns by company category. There was a bit of reshuffling among the U.S. MSOs, with Tier 3 companies now leading in YTD performance. Psychedelics dropped another notch to sixth place after ranking first only a few weeks ago.
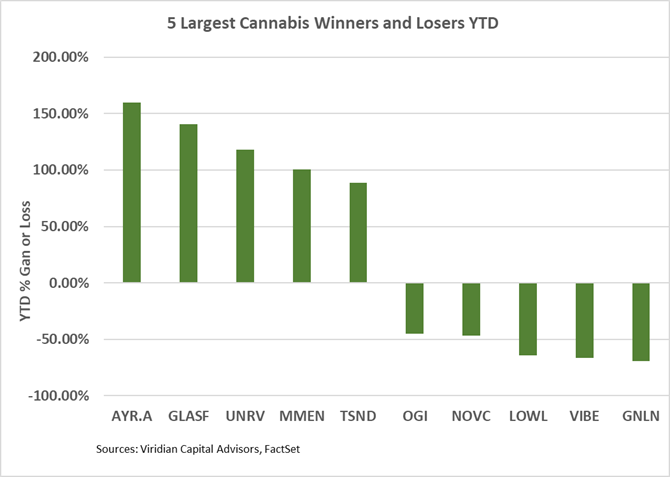
Best and Worst Performers of the last week and YTD:
- We are surprised to see both Canopy Growth (CGC: Nasdaq) and Aurora Cannabis (ACB: Nasdaq) in the top five gainers. We do not believe Canadian LPs will benefit significantly from U.S. rescheduling. Cannabis will continue to be federally illegal, and neither interstate commerce nor full legality is on the visible horizon. Aurora is principally up on the news that by shifting its Nasdaq listing, it can buy an additional 180 days to meet listing requirements. Is this news worthy of a big stock rally? Similarly, Canopy staunches its Biosteel bleeding by waking away and then does a $50M dilutive equity issuance. It’s not exactly the kind of good news that one stands up and cheers about.