OUR 9TH YEAR OF PROVIDING PROPRIETARY CAPITAL MARKETS INTELLIGENCE ON THE CANNABIS / HEMP / PSYCHEDELIC SECTORS
Each week, Viridian publishes insights and analysis on completed capital raise transactions in the prior week, focusing on all equity and debt deals. Our analysis includes:
- Summary
- Outlook
- Best & Worst Perfromers
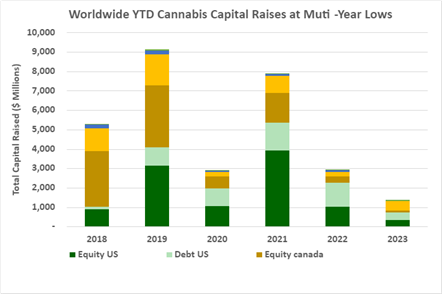
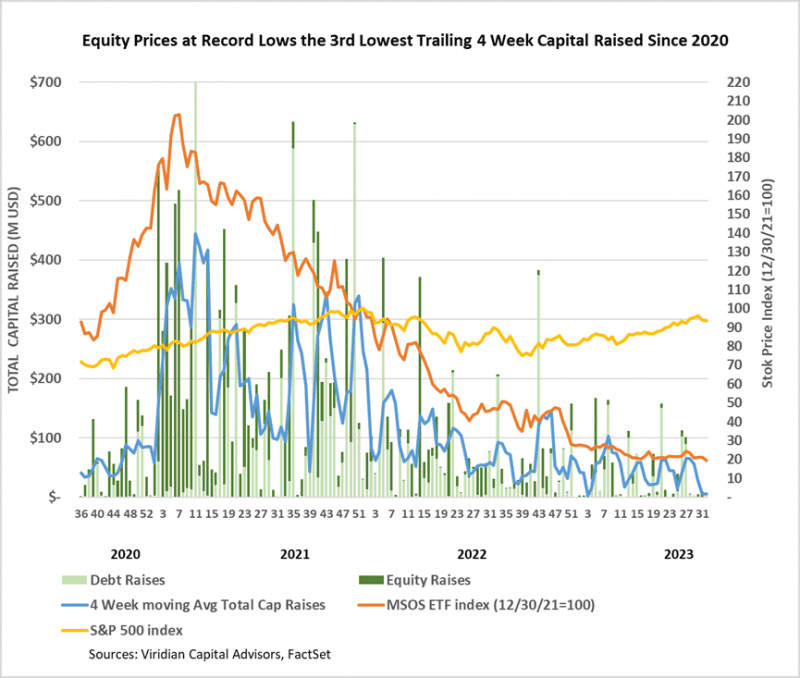
- Cannabis capital raises are off to a multi-year low. Only $1.37B closed through the first thirty-two weeks of the year compared to $2.93B last year.
- Debt represents 68.6% of total capital raised, significantly higher than in any other comparable period since 2018.
- Public companies have raised 69.7% of total capital YTD, down from 74.0% last year and lower than any comparable period since 2019.
VIRIDIAN INSIGHTS
- The Most Important Small Transaction in Recent Cannabis History.
- On July 31, 2023, Pelorus Capital Group completed the first securitization of cannabis loans.
- Pelorus took a portfolio of nine cannabis loans aggregating $75M and yielding a weighted average of 15% and sold a $45M Senior tranche at 11%
- The remaining $25M piece that Pelorus held on to mathematically yields approximately 22%.
- The importance of this transaction cannot be overstated. It provides a method by which institutional investors can directly participate in cannabis lending, albeit with structural enhancement that adds to the relative safety.
- This is just the beginning. We foresee a flood of similar transactions that will revitalize funding for cannabis lenders by bringing institutional capital into the fold. The full creativity of securitization will be unleashed in cannabis. There is no reason why a thin layer of the structure cannot achieve investment-grade ratings, and similarly, levered-up tranches will produce equity-like returns. We expect to see multiple versions of this transaction executed over the remainder of 2023 and into 2024.
Amend and Extend
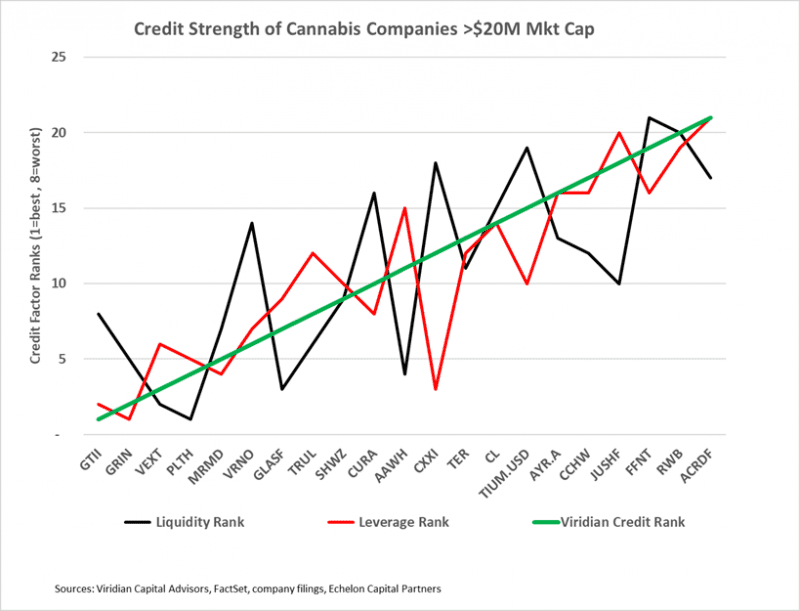
- The chart below shows our updated credit rankings for the 21 U.S. cannabis companies with over $20M market cap. The weakest credits on the right-hand side of the chart generally have significant debt maturities in 2024 and 2025 combined with leverage that we view as unsustainable in the long run. Fixing the debt overhang without horrifically diluting shareholders is a tricky matter. No company wants to issue equity at all-time low prices. The easiest refinancing using real estate collateral has already been done. So, we think the industry is in “amend and extend” mode for the near future. Like StateHouse, companies will be working to recut their covenants and extend their maturities at the cost of fees, premiums at redemption, and incremental warrants.

Volume Building?
- On July 3, 2023, TerrAscend Corp. (TER: CSE)(TRSSF: OTCQX) began to trade on the TSX exchange. Its first day of trading on July 4 wasn’t a fair test, but for the record, the company traded approximately 50.8k shares at average prices of about $1.82 for a dollar volume of around $92.5K
- The graph below shows the total dollar trading volume on Canadian exchanges (blue bars) and OTCQX (orange bars) for the two weeks before and five after TerrAscend’s TSX commencement on 7/3/23. There is not much of a pattern of increased volume here, and on fifteen of the twenty-one trading days since the switchover from CSE to TSX, the company traded more volume on the OTCQX than on the TSX. We see a few volume spikes over $1M daily, but it is not dramatic.
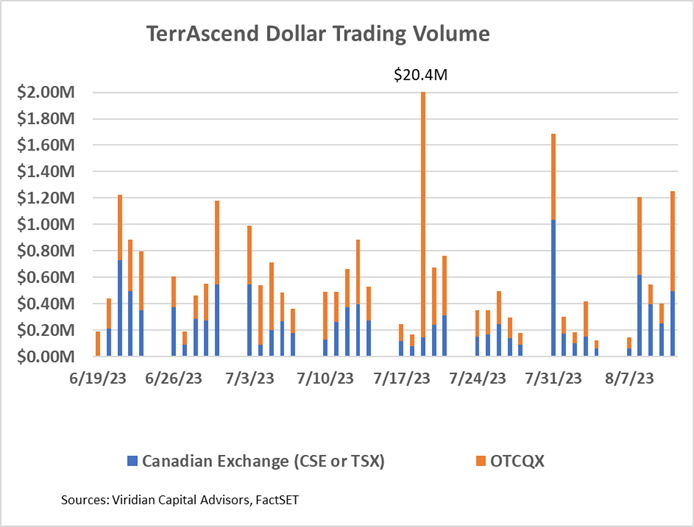
- Although it is still reasonably early to gauge the impact of the move to the TSX, many observers, us included, are scratching their heads at the modest impact that has been seen so far.
- Meanwhile, Curaleaf (CURA: CSE)(CURLF: OTCXQX) announced that it intends to be the second major MSO to list on the TSX. Curaleaf is a natural candidate with its robust European operations and should need fewer reorganization steps than most domestic operators. Moreover, CURA may better demonstrate the liquidity-increasing impact of the TSX since it has a much bigger float.
Positive Earnings Surprises Produce a Yawn from Equity Market
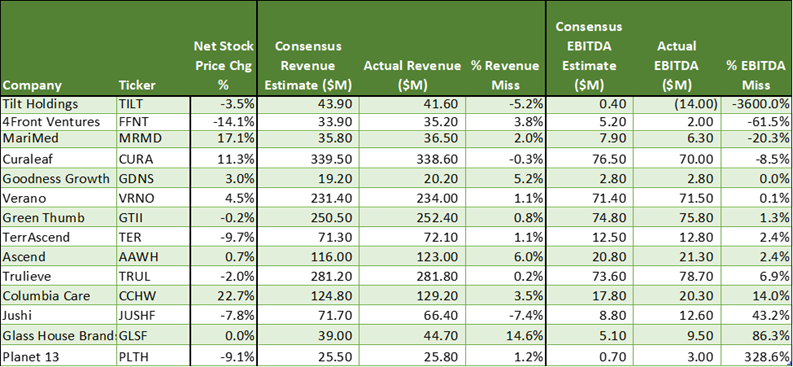
- We are primarily through 2nd quarter earnings releases, and the results have generally been favorable. Nine of the fourteen companies that have released results beat consensus EBITDA estimates. The stock market has not been rewarding. The Net stock gain column shows the stock movement from the day before the announcement to the day after, adjusted for changes in the MSOS ETF. Note the lack of correlation between beats/misses and net stock price performance. Five of the nine companies with earnings beats had a negative net stock performance.
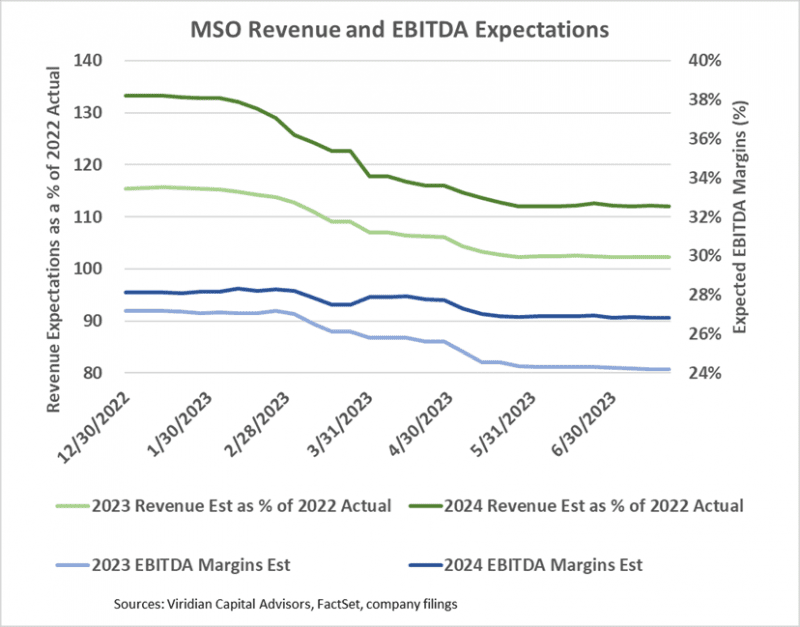
- The chart below looks at 2023 and 2024 revenue and EBITDA estimates. Once again, the 2023 numbers do not look heroic: 2023 revenues for the group of ten largest MSOS are now only projected to be 2% higher than in 2022, and 2024 revenues are projected to be 12% higher than 2022 (a 5.8% CAGR). EBITDA margins are projected to drop from 25% in 2022 to 24% in 2023 before rebounding to 27% in 2024. Although we aren’t entirely comfortable with the 2024 margin expansion, we can’t say that the projections are super aggressive.
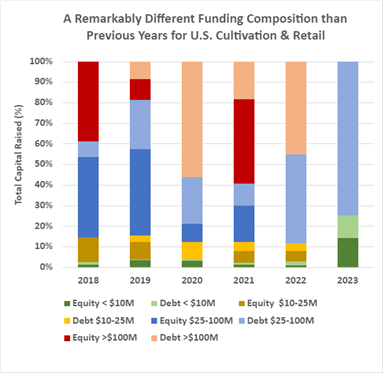
- YTD, U.S. Cultivation & Retail sector capital raises are down 77.7% from 2022 and are lower than any previous comparable period since before 2018.
- Debt is still the dominant form of funding, accounting for 85.7% of all cultivation sector capital raised. 15.6% of the debt raised YTD has been for private companies.
- Large transactions are still absent from the market. There have been no debt or equity deals over $100M YTD. The graph below shows the strikingly different composition of U.S. Cultivation & Retail capital raises in 2023 compared to previous years, with small equity and midsized debt dominating raises.
- Cannabis equities (as measured by the MSOS ETF) were down 6.88% for the week.
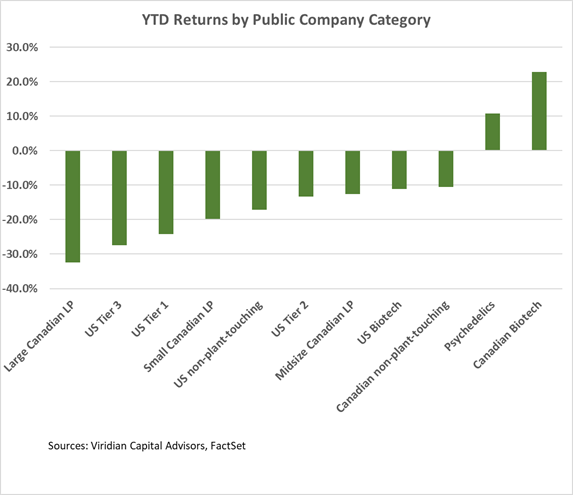
YTD Returns by Public Company Category
- The public company category ranking remained unchanged from last week except for a one-place downward movement for U.S. Tier One companies.
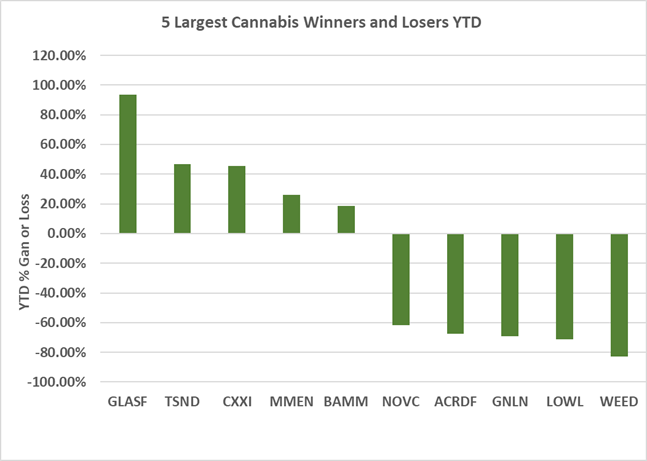
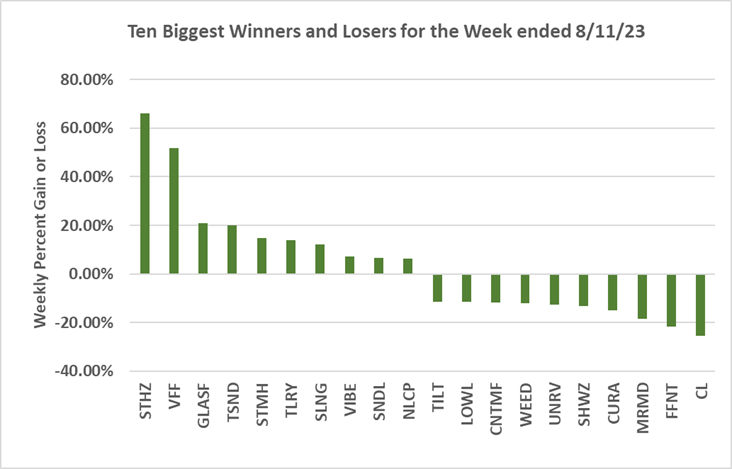
Best and Worst Performers of the last week and YTD:
- StateHouse (STHZ: CSE)(STHZF: OTCQX) repeated as the week’s best performer, gaining 66% to $0.037 on its Pelorus facility’s successful enlargement and extension. The stock is still about 50% down YTD.
- Village Farms (VFF: Nasdaq) was up 52% after beating June revenue and EBITDA consensus estimates.
- 4Front (FFNT: CSE) was down 21.55% after announcing a delay in its June 10Q filing.