OUR 9TH YEAR OF PROVIDING PROPRIETARY CAPITAL MARKETS INTELLIGENCE ON THE CANNABIS / HEMP / PSYCHEDELIC SECTORS
Each week, Viridian publishes insights and analysis on completed capital raise transactions in the prior week, focusing on all equity and debt deals. Our analysis includes:
- Summary
- Outlook
- Best & Worst Perfromers
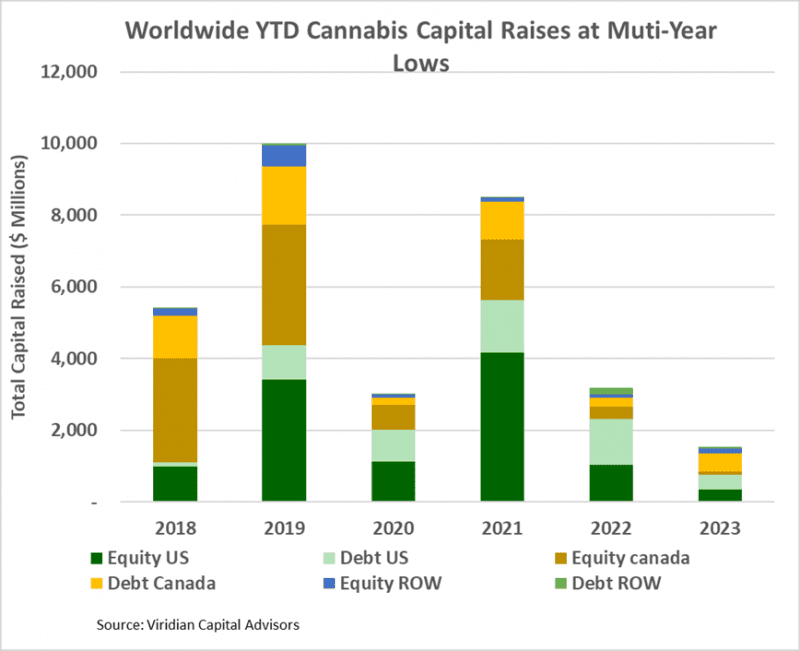
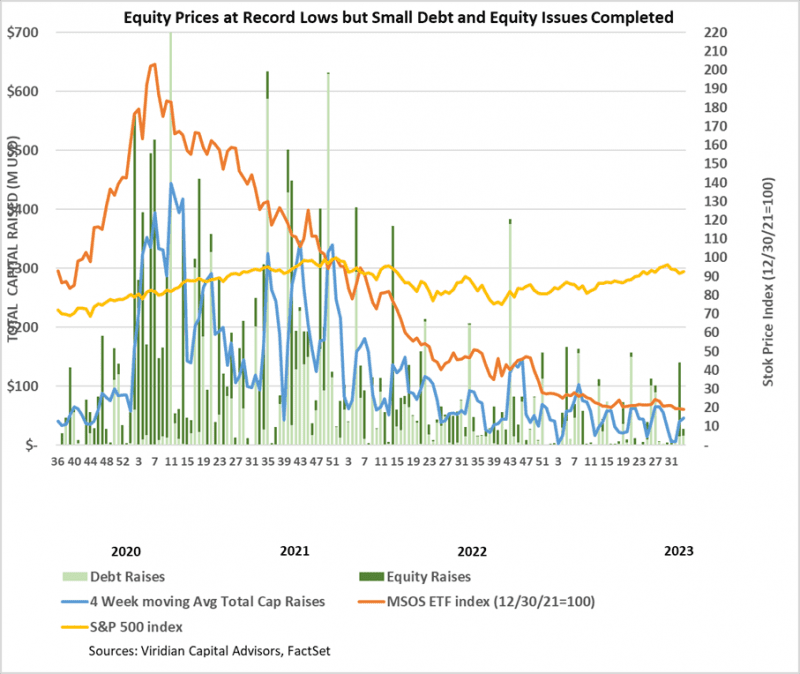
- Cannabis capital raises are off to a multi-year low. Only $1.54B closed through the first thirty-four weeks of the year compared to $3.18B last year.
- Debt represents 62.4% of total capital raised, significantly higher than in any other comparable period since 2018.
- Public companies have raised 73.0% of total capital YTD, down from 74.7% last year and lower than any comparable period since 2019.
- International raises accounted for 12.4% of the total, the most significant percentage since before 2018.
VIRIDIAN INSIGHTS
- Slower Growth and Capital Intensity
-
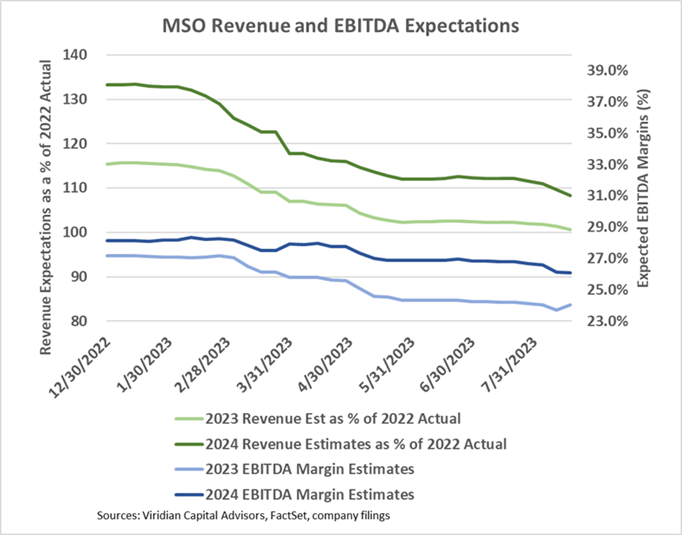
- The graph below shows consensus revenue and EBITDA estimates for the 10 top MSOs for 2023 and 2024. The light blue line at the bottom shows that 2023 consensus EBITDA margins are now 24.0%, down from the beginning of the year expectations of 27.2% and 2022 actual margins of 25.0%. 2024 margins, shown in the dark blue line, are now expected to be 26.1%.
- The green lines at the top show that 2023 revenues are expected to be 1% higher than 2022, while 2024 revenues are expected to be 8% higher than 2022. The 3.9% CAGR is decidedly anemic and reflects ongoing wholesale price compression, somewhat offset by positive impacts of new adult rec states.
-
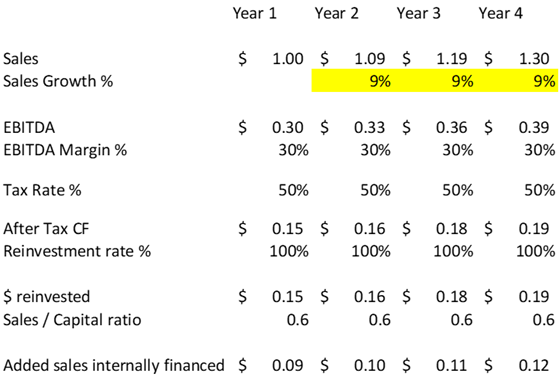
- The Viridian Chart of the Week added a new perspective to the slower-than-expected growth cannabis seems to be experiencing. Our chart showed that the top 14 cannabis MSOs average only $.60 of sales per dollar invested capital. The chart below uses this number in a thought experiment regarding internally financeable growth rates possible for cannabis. We have assumed 30% EBITDA margins, 50% tax rates on EBITDA, 0.6x sales/capital ratios, and 100% reinvestment of all internally generated free cash flow. The table suggests that cannabis companies should be able to internally finance approximately 9% revenue growth.
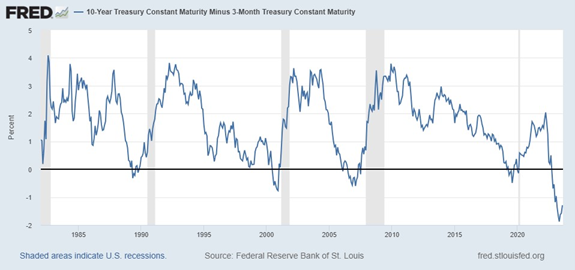
- The Yield Curve Inversion Increased This Week
-
- The 3-month – 10-year yield spread is now -144bp, a 25bp flattening from its most negative reading in May but 21bp more negative than last week and still more negative than in any period in the previous 35 years.
- Jay Powell thoroughly squashed calls by several to give up on the 2% inflation target and adopt a more lenient 3% target. Powell’s hawkish tone puts another rate rise squarely back on the table. We are not surprised as he has been quite forthright in his insistence that curing inflation takes precedence over the risk of economic weakening or recession.
- Amend and Extend
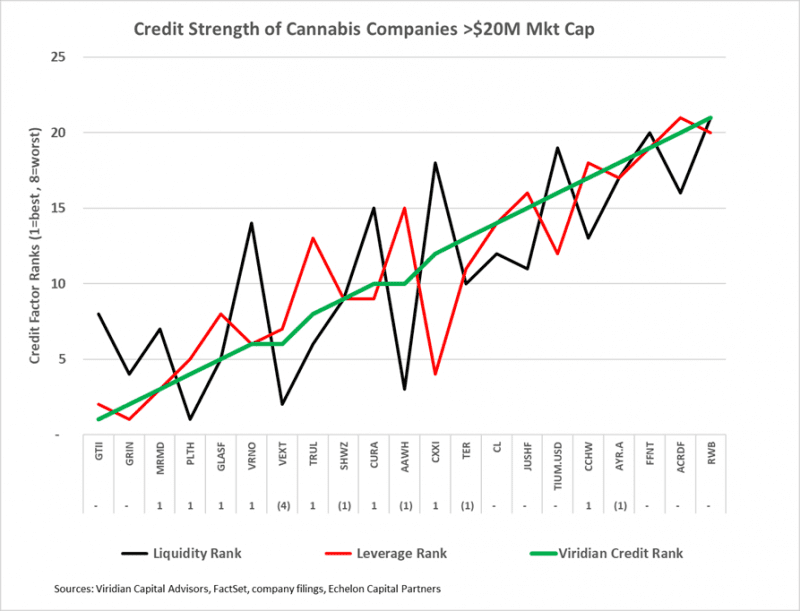
- The chart below shows our updated credit rankings for the 21 U.S. cannabis companies with over $20M market cap. The number below the ticker symbol indicates the change in credit ranking since last week, where a negative number suggests credit deterioration while a positive indicates improvement. The most significant difference for this week is a four-ranking slot deterioration in VEXT Science (VEXT: CSE). The weakest credits on the right-hand side of the chart generally have significant debt maturities in 2024 and 2025 combined with leverage that we view as unsustainable in the long run.
- Improving Liquidity?
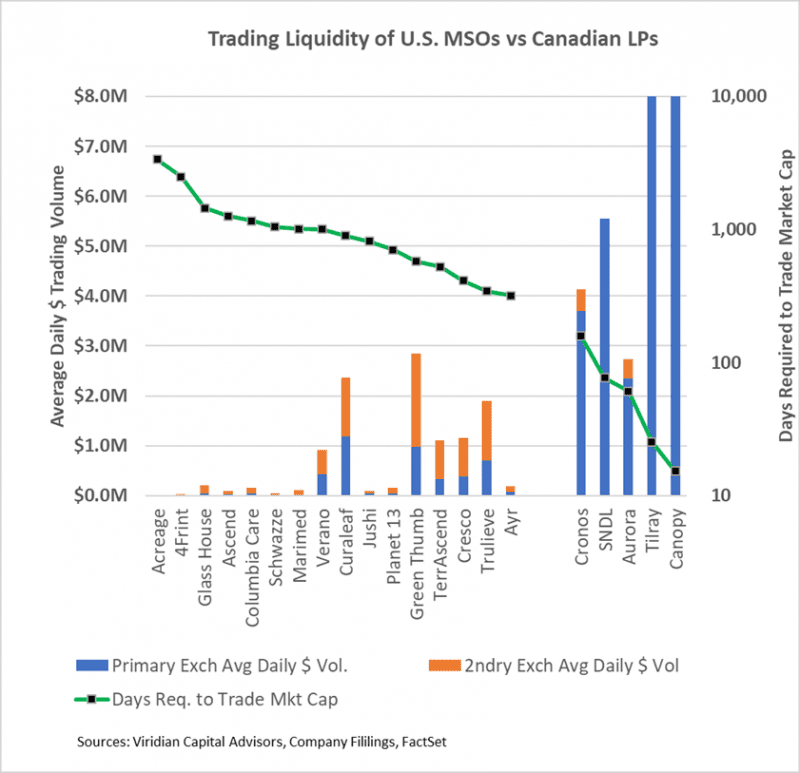
- The chart below shows the relative trading liquidity of sixteen U.S. MSOs against the six largest market-cap Canadian LPs. The blue bars indicate the average daily trading volume on the primary exchange from 6/30/23 through 8/18/23. For U.S. companies, the primary exchange is assumed to be the CSE, NEO, or TSX (in the case of TerrAscend), while the secondary exchange (orange bar) is the OTC. For Canadian companies, the primary exchange is the Nasdaq, while the secondary exchange is the CSE or TSX.
- The green line depicts the days of average daily volume required to trade the company’s market cap. We view this as the best overall indicator of the liquidity of a stock. The six U.S. companies on the left side of the graph all have over 1000 days required to trade the market cap. In perspective, if an investor has a 5% position in a company’s stock and wants to sell out of it, assuming they want to be less than 25% of the average daily volume, it would take the investor 200 days to exit the position. This illustrates one of the most pressing issues in getting more institutional interest in cannabis stocks – no investor wants to be locked up for this long.
- TerrAscend days to trade market cap is now lower than Green Thumb’s, quite an achievement given that before uplisting to the TSX, TSND had the second worst number on the chart. The company registered over 1000 days as recently as June but is now down to 527 days. Glass House has gone in the opposite direction. It was side-by-side with TerrAscend on a third quarter-to-date basis as of last week but has drifted much lower in liquidity reading this week.
-
- Curaleaf (CURA: CSE)(CURLF: OTCXQX) announced it intends to be the second major MSO to list on the TSX. Curaleaf is a natural candidate with its robust European operations and should need fewer reorganization steps than most domestic operators. Moreover, CURA may better demonstrate the liquidity-increasing impact of the TSX since it has a much bigger float.
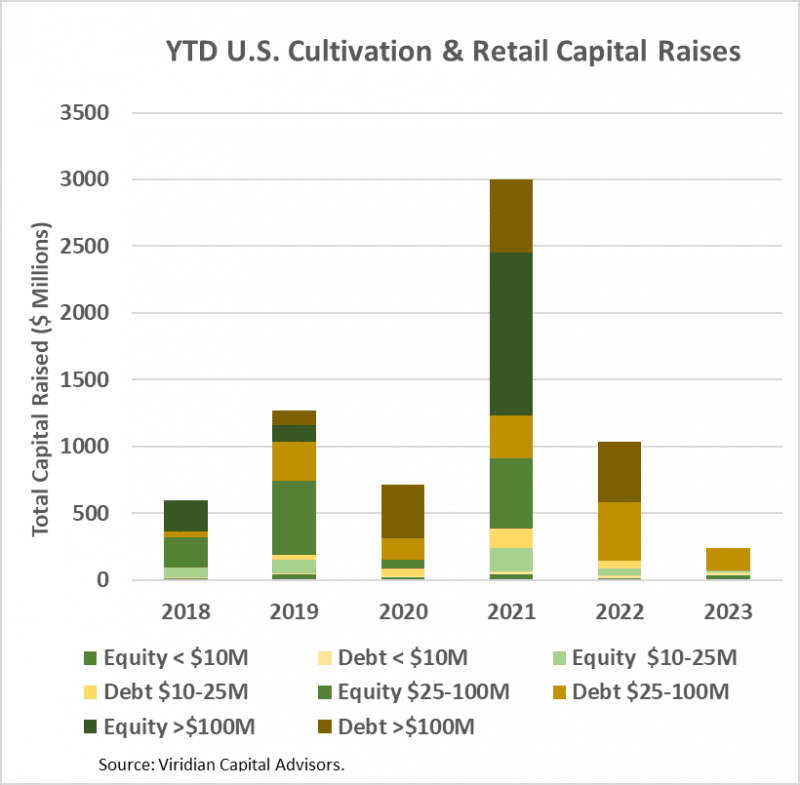
- YTD, U.S. Cultivation & Retail sector capital raises are down 77.3% from 2022 and are lower than any previous comparable period since before 2018.
- Debt is still the dominant form of funding, accounting for 80.3% of all cultivation sector capital raised. 14.9% of the debt raised YTD has been for private companies.
- Large transactions are still absent from the market. There have been no debt or equity deals over $100M YTD. The graph below shows the strikingly different composition of U.S. Cultivation & Retail capital raises in 2023 compared to previous years, with small equity and midsized debt dominating raises.
- Cannabis equities (as measured by the MSOS ETF) were down 1.21% for the week.
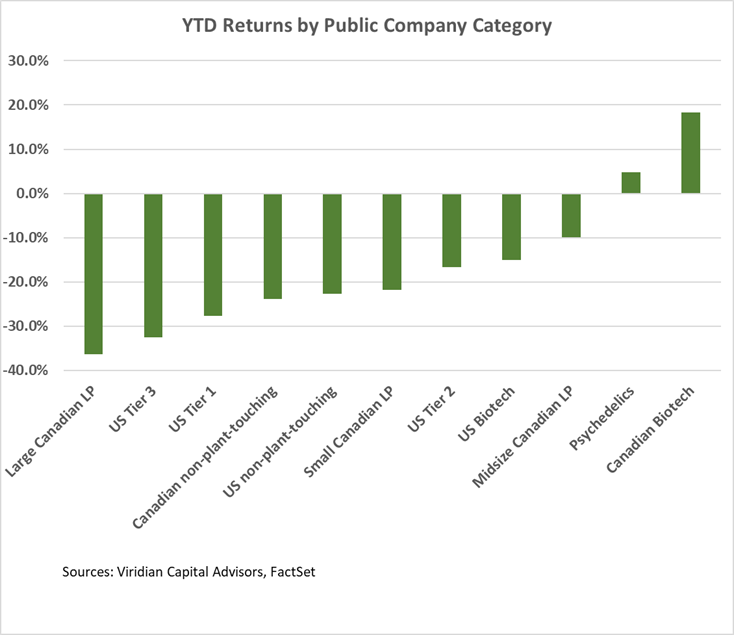
YTD Returns by Public Company Category
- Large Canadian LPs sunk one notch to become the worst-performing category YTD, mainly due to the 15.5% decline in Canopy Growth (CGC: Nasdaq) and the 13.2% decline in Aurora Cannabis (ACB: Nasdaq).
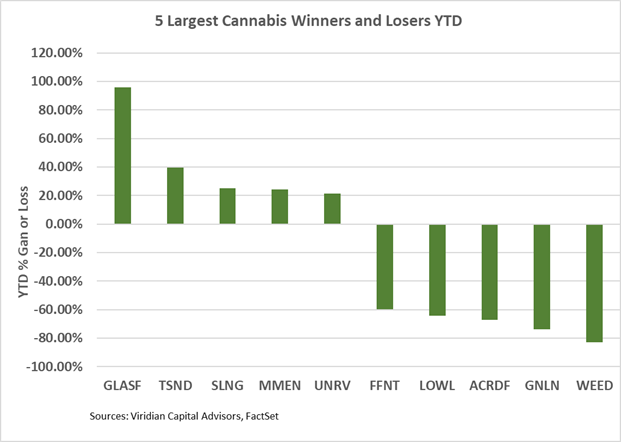
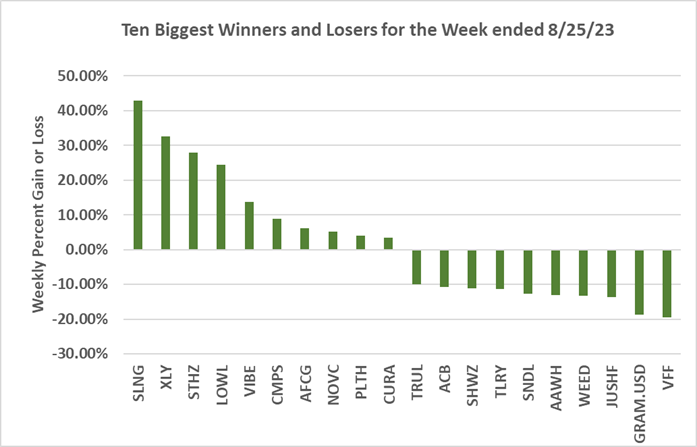
Best and Worst Performers of the last week and YTD:
- Slang Worldwide (SLNG: CSE), StateHouse (STHZ: CSE)(STHZF: OTCQX), and Auxly (XLY: TSX) were the week’s three best performers, each up over 25%. After leading the losers list last week, all three appear to be little beyond technical bounces.
- Village Farms (VFF: Nasdaq) is the largest loser, down 43.5%. The stock has been sliding for the last three weeks after rocketing upward by over 50% earlier in the month on stronger-than-expected Q2 results.