OUR 9TH YEAR OF PROVIDING PROPRIETARY CAPITAL MARKETS INTELLIGENCE ON THE CANNABIS / HEMP / PSYCHEDELIC SECTORS
Each week, Viridian publishes insights and analysis on completed capital raise transactions in the prior week, focusing on all equity and debt deals. Our analysis includes:
- Summary
- Outlook
- Best & Worst Perfromers
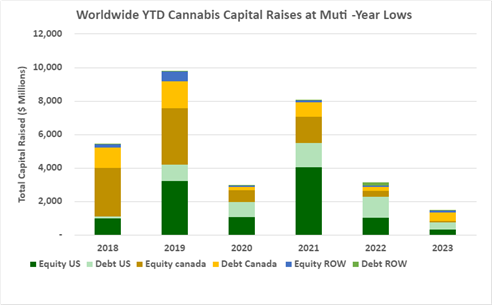
- Cannabis capital raises are off to a multi-year low. Only $1.51B closed through the first thirty-three weeks of the year compared to $3.14B last year.
- Debt represents 63.2% of total capital raised, significantly higher than in any other comparable period since 2018.
- Public companies have raised 72.5% of total capital YTD, down from 75.8% last year and lower than any comparable period since 2019.
- International raises accounted for 12.6% of the total, the most significant percentage since before 2018.
VIRIDIAN INSIGHTS
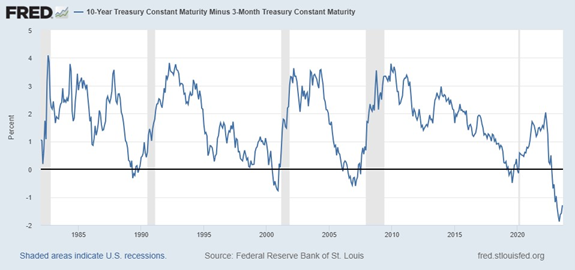
- The Yield Curve Has Become a Bit Less Inverted
- The 3-month – 10-year yield spread is now -123bp, a 65bp flattening from its most negative reading in May but still more negative than in any period in the last 35 years.
- Pundits are now questioning the power of the yield curve to predict future recessions because it has been inverted for nearly a year with no signs of economic weakening. We believe the curve still points to an upcoming recession; however, the cumulative impacts of a decade of easy money and the covid stimulus programs have taken a long time to work through the system. We would caution against concluding the risk is over, particularly given the weakening in China and the overhang of impending office real estate refinancings.
- Several academics have called on the FED to give up on its 2% inflation target and adopt a more lenient 3% target. We do not read Jay Powell as giving in to this “move the goalposts” strategy. The call for reduced targeting seems primarily based on giving the FED more leeway to avoid causing economic damage in its inflation fight; however, the FED has been forthright in its insistence that curing inflation takes precedence over the risk of economic weakening or recession.
- Accordingly, odds makers have begun to favor an additional rate increase, with higher rates staying longer.
- Amend and Extend
-
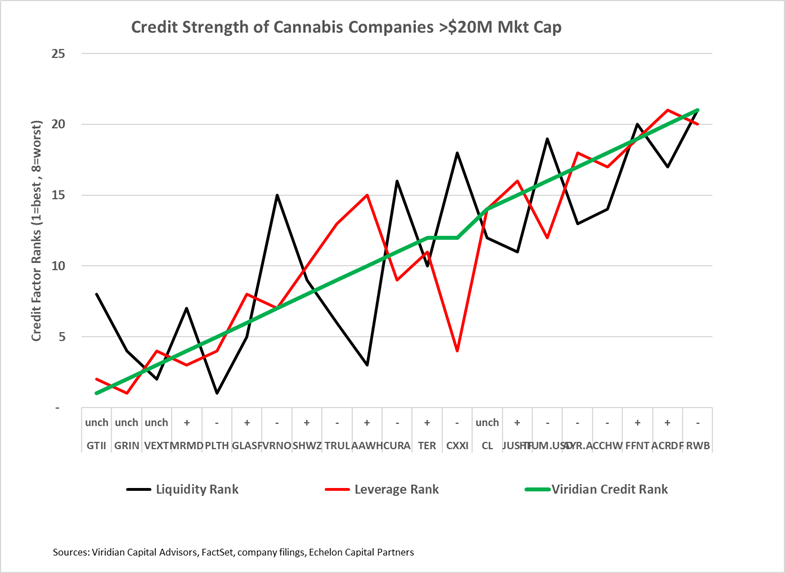
- The chart below shows our updated credit rankings for the 21 U.S. cannabis companies with over $20M market cap. Beginning this week, we have also included an indicator of whether the company improved in ranking this week (+), deteriorated (-), or remained unchanged (unch). The weakest credits on the right-hand side of the chart generally have significant debt maturities in 2024 and 2025 combined with leverage that we view as unsustainable in the long run.
- Fixing the debt overhang without horrifically diluting shareholders is a tricky matter. No company wants to issue equity at all-time low prices. The easiest refinancing using real estate collateral has already been done. So, we think the industry is in “amend and extend” mode for the near future. Like StateHouse, companies will be working to recut their covenants and extend their maturities at the cost of fees, premiums at redemption, and incremental warrants.
- Second-quarter financials show that companies are making a concerted effort to reduce inventories as an additional way to increase cash flow. Better working capital management may allow for more internal debt paydown, albeit at weaker profit margins.
- Improving Liquidity?
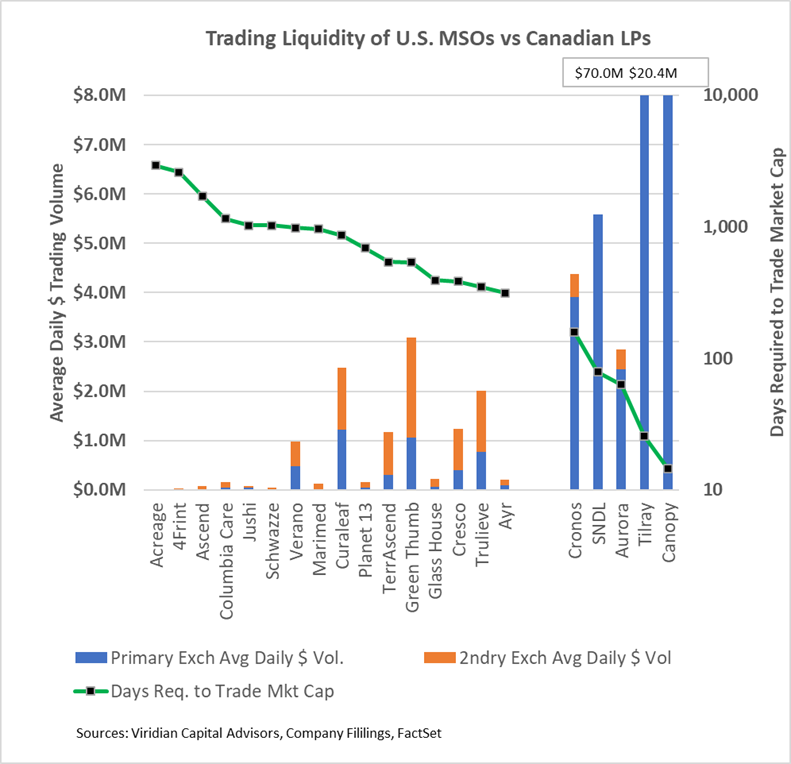
- The chart below shows the relative trading liquidity of sixteen U.S. MSOs against the six largest market-cap Canadian LPs. The blue bars indicate the average daily trading volume on the primary exchange from 6/30/23 through 8/18/23. For U.S. companies, the primary exchange is assumed to be the CSE, NEO, or TSX (in the case of TerrAscend), while the secondary exchange (orange bar) is the OTC. For Canadian companies, the primary exchange is the Nasdaq, while the secondary exchange is the CSE or TSX.
- None of the U.S. companies had a higher average daily volume on Canadian exchanges, including TerrAscend.
- The green line depicts the days of average daily volume required to trade the company’s market cap. We view this as the best overall indicator of the liquidity of a stock. The six U.S. companies on the left side of the graph all have over 1000 days required to trade the market cap. In perspective, if an investor has a 5% position in a company’s stock and wants to sell out of it, assuming they want to be less than 25% of the average daily volume, it would take the investor 200 days to exit the position. This illustrates one of the most pressing issues in getting more institutional interest in cannabis stocks – no investor wants to be locked up for this long.
- TerrAscend has made progress since its July 3 opening on the TSX. The company registered over 1000 days as recently as June but is now down to 633 days. The average of the Canadian LPs shown on the graph is 68 days. The TSX may be an improvement, but it is nowhere near the Nasdaq in liquidity.
-
- Curaleaf (CURA: CSE)(CURLF: OTCXQX) announced it intends to be the second major MSO to list on the TSX. Curaleaf is a natural candidate with its robust European operations and should need fewer reorganization steps than most domestic operators. Moreover, CURA may better demonstrate the liquidity-increasing impact of the TSX since it has a much bigger float.
- Positive Earnings “Surprises” Produce a Well-Deserved Yawn from Equity Market
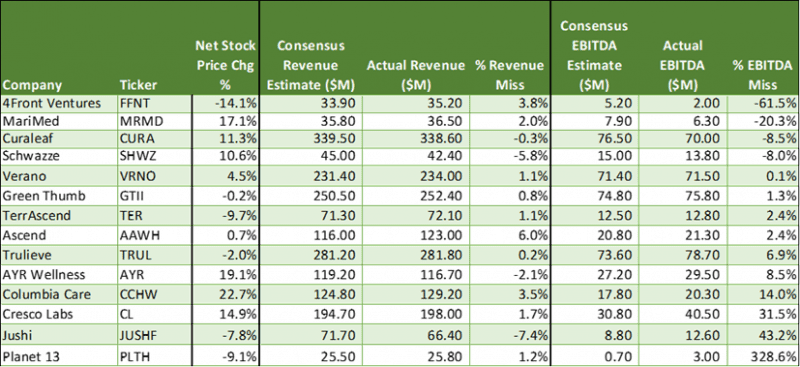
- We are through 2nd quarter earnings releases, and the results have generally been favorable. Ten of the fourteen companies that have released results beat consensus EBITDA estimates. The stock market response, however, has been mainly uncorrelated to the EBITDA beats/misses. The Net stock gain column shows the stock movement from the day before the announcement to the day after, adjusted for changes in the MSOS ETF. One reason for the uncorrelated market response is the transparent management of expectations that occurred this quarter. Earnings estimates were “talked down” significantly two weeks before releases, making for easier beats.
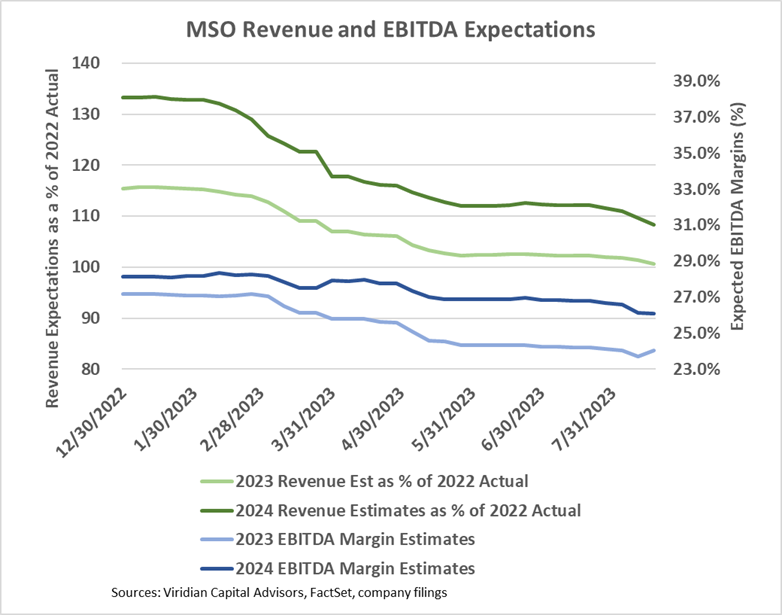
- Our chart of the week, however, details that full-year 2023 EBITDA estimates are still below 2022 estimates and are somewhat suspect because analysts have projected improvement in the second half of the year versus the second half of 2022, despite the first two quarters significantly underperforming on that basis.
-
- The graph below shows consensus revenue and EBITDA estimates for the 10 top MSOs for 2023 and 2024. The light blue line at the bottom shows that 2023 consensus EBITDA margins are now 24.0%, down from the beginning of the year expectations of 27.2% and 2022 actual margins of 25.0%. 2024 margins, shown in the dark blue line, are now expected to be 26.1%
- The green lines at the top show that 2023 revenues are expected to be 1% higher than 2022, while 2024 revenues are expected to be 8% higher than 2022. The 3.9% CAGR is decidedly anemic and reflects ongoing wholesale price compression, somewhat offset by positive impacts of new adult rec states.
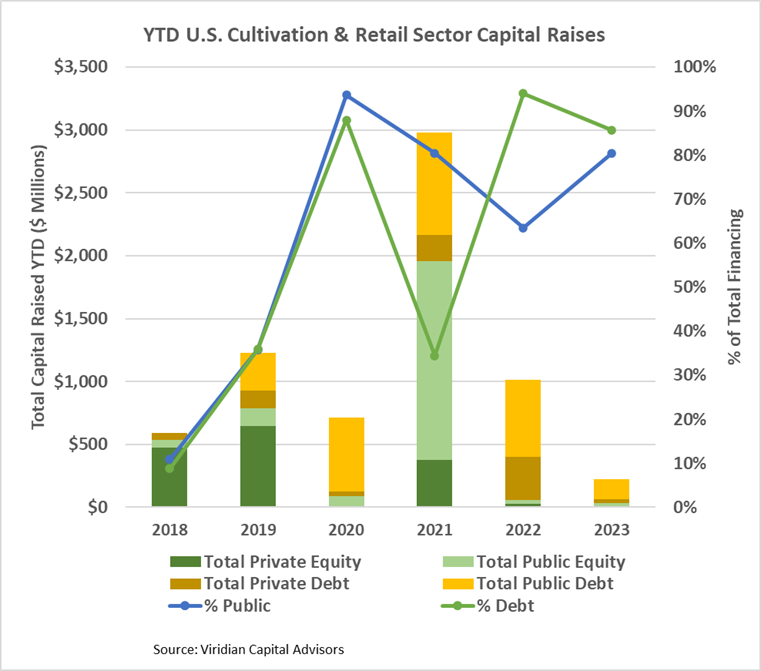
- YTD, U.S. Cultivation & Retail sector capital raises are down 77.8% from 2022 and are lower than any previous comparable period since before 2018.
- Debt is still the dominant form of funding, accounting for 85.7% of all cultivation sector capital raised. 15.6% of the debt raised YTD has been for private companies.
- Large transactions are still absent from the market. There have been no debt or equity deals over $100M YTD. The graph below shows the strikingly different composition of U.S. Cultivation & Retail capital raises in 2023 compared to previous years, with small equity and midsized debt dominating raises.
- Cannabis equities (as measured by the MSOS ETF) were down 1.0% for the week.
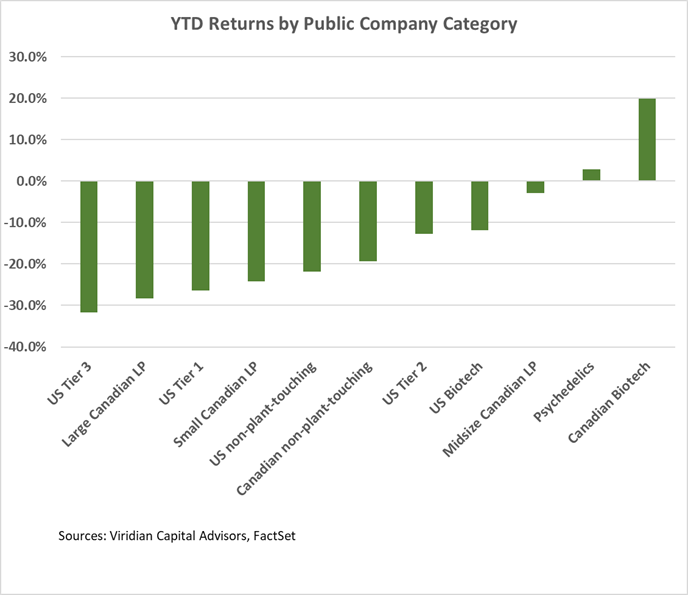
YTD Returns by Public Company Category
- Midsized Canadian LPs improved two notches to become the third best performing category primarily on Organigram’s 18% weekly gain (OGI: CSE). U.S. Tier 3 MSOs lost a notch to become the worst-performing category primarily because of the 30% weekly loss by StateHouse (STHZ: OTCQB) and the 15% weekly loss by Vext Science (VEXT: OTC).
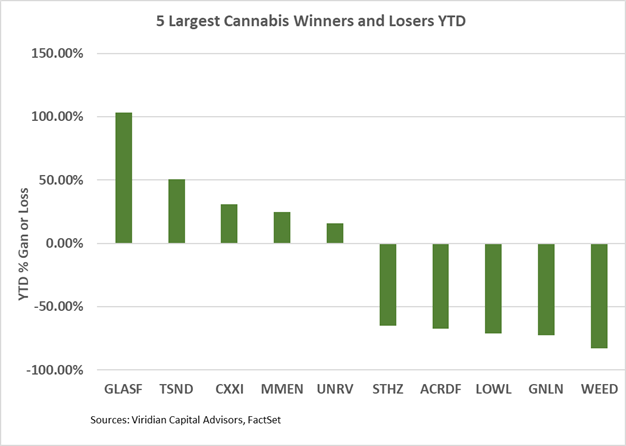
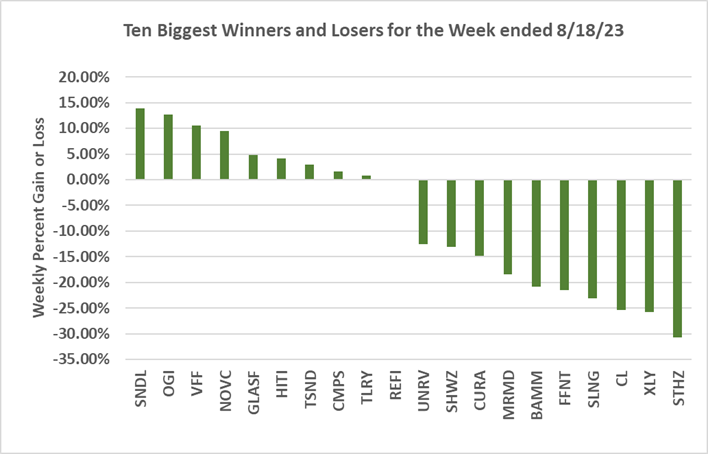
Best and Worst Performers of the last week and YTD:
- StateHouse (STHZ: CSE)(STHZF: OTCQX) was the week’s worst performer, losing 30% after two weeks on the leaders list.
- The top four gainers were all Canadian LPs: SNDL (SNDL: Nasdaq), Organigram (OGI: CSE), Village Farms (VFF: OTCQX), and Nova Cannabis (NOVC: CSE) were all up over 9%.