OUR 9TH YEAR OF PROVIDING PROPRIETARY CAPITAL MARKETS INTELLIGENCE ON THE CANNABIS / HEMP / PSYCHEDELIC SECTORS
Each week, Viridian publishes insights and analysis on completed capital raise transactions in the prior week, focusing on all equity and debt deals. Our analysis includes:
- Summary
- Outlook
- Best & Worst Perfromers
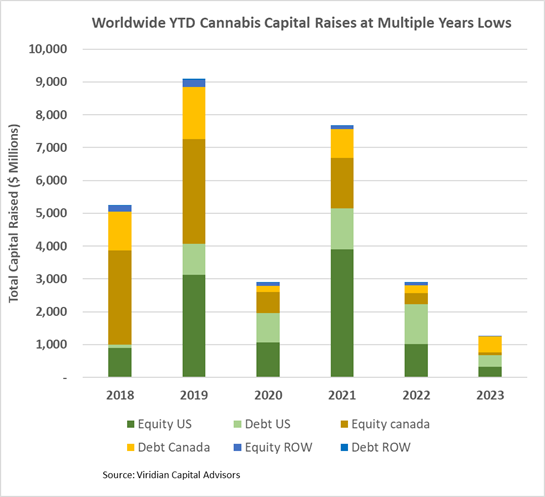
- Cannabis capital raises are off to a multi-year low. Only $1.32B closed through the first thirty-one weeks of the year compared to $2.90B last year.
- Debt represents 67.4% of total capital raised, significantly higher than in any other comparable period since 2018.
- Public companies have raised 72.3% of total capital YTD, down from 73.8% last year and lower than any comparable period since 2019.
VIRIDIAN INSIGHTS
Amend and Extend
- Last week, we discussed the last-minute kick save where Pelorus rescued StateHouse from what looked like imminent default.
- This week Auxly ran the same play by getting Imperial Brands to extend maturities by two years.
- The playbook is not new. Review the machinations that Gotham Green went through to keep MedMen alive: amend covenants liberally, provide a splash of incremental liquidity when necessary, and maintain senior secured status but continue to eke out a higher percentage of the company through new warrants and reduced exercise prices on old warrants/ converts. In other words, play for optionality. We expect more of the same.
- Columbia Care (CCHW: NEO) is negotiating with the holders of its $38M 13%s of 5/24 to get them to convert on a one-to-one basis for the company’s 6s of 2025. This is a fascinating attempt at balance sheet management. The 6s have a much lower coupon and a longer maturity. They are currently offered at about 78 to yield 20.6%, a similar yield to the 13s now offered at 95.
- So why would I, as a bondholder, entertain this exchange, and what will the company be able to do to make the economics work for me? One obvious gambit we think we will see more of is reducing the conversion price of the 6s of 25 from their current way-out-of-the-money price of $6.49. How much value would you create by reducing that price to the market price of $0.43? Not that much, as it turns out! It would add about $1.95M or about five bond points. The issue is the short maturity/short duration warrants. So, what else can we come up with? We could add more warrants, and I would suggest long-maturity significant premium warrants. We are also told the company may be toying with a premium redemption price, which may be the most direct method since, with their short maturity, you capture a great deal of the redemption premium as the current value. Suffice it to say; we expect to see many more of these at increasing levels of complexity.
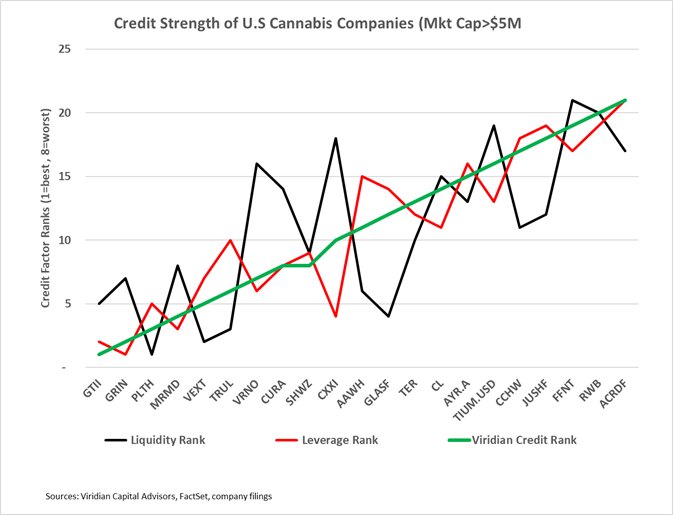
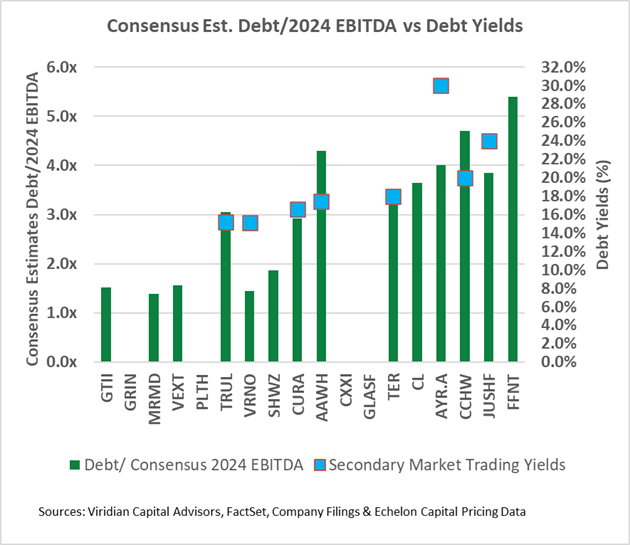
- The chart below shows our credit rankings for the 19 U.S. cannabis companies with over $20M market cap. The companies on the right 1/3 of the graph are “amend and extend” candidates.
Where’s the Volume?
- On July 3, 2023, TerrAscend Corp. (TER: CSE)(TRSSF: OTCQX) began to trade on the TSX exchange. Its first day of trading on July 4 wasn’t a fair test, but for the record, the company traded approximately 50.8k shares at average prices of about $1.82 for a dollar volume of around $92.5K
- The graph below shows the total dollar trading volume on Canadian exchanges (blue bars) and OTCQX (orange bars) for the two weeks before and four and one half after TerrAscend’s TSX commencement on 7/3/23. There is not much of a pattern of increased volume here, and on fifteen of the twenty-one trading days since the switchover from CSE to TSX, the company traded more volume on the OTCQX than on the TSX. We do see two significant spikes. The larger of the two happened on July 19. Dollar trading volume was $20.4M, about 38 times the company’s average What are we to make of that? And why did the trading occur on the OTCQX rather than the TSX? The other much smaller spike was on July 31, with a dollar volume of $1.69 million. More than $1M traded on the TSX for the first time.
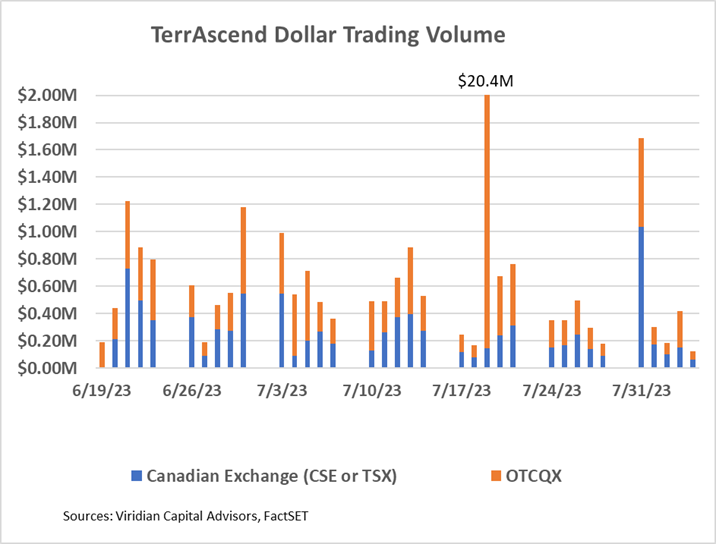
- Although it is still reasonably early to gauge the impact of the move to the TSX, many observers, us included, are scratching their heads at the modest impact that has been seen so far.
- Meanwhile, Curaleaf (CURA: CSE)(CURLF: OTCXQX) announced that it intends to be the second major MSO to list on the TSX. Curaleaf is a natural candidate with its robust European operations and should need fewer reorganization steps than most domestic operators. Moreover, CURA may better demonstrate the liquidity-increasing impact of the TSX since it has a much bigger float.
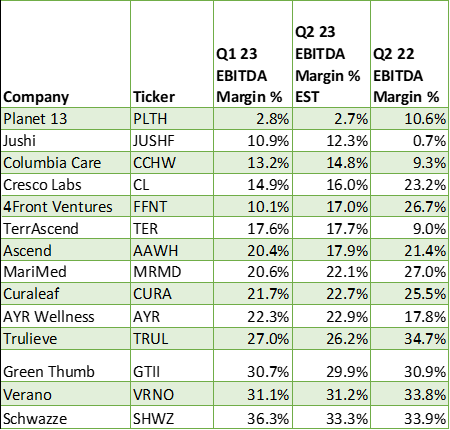
- Earnings season is approaching again, and the table below shows the EBITDA margins for Q1:23, Q2:23 projected, and Q2:22 for fourteen of the top MSOs. As expected, most companies have higher projected margins for the second quarter, primarily because it is a seasonally stronger quarter. Most companies also have weaker expected margins for Q2:23 than last year’s quarter, also expected due to the negative impacts of wholesale price compression matched with inflationary cost increases. The outliers to these trends were fascinating. See the Chart of the Week for more detail. We will pay close attention to estimate revisions after the results are released.
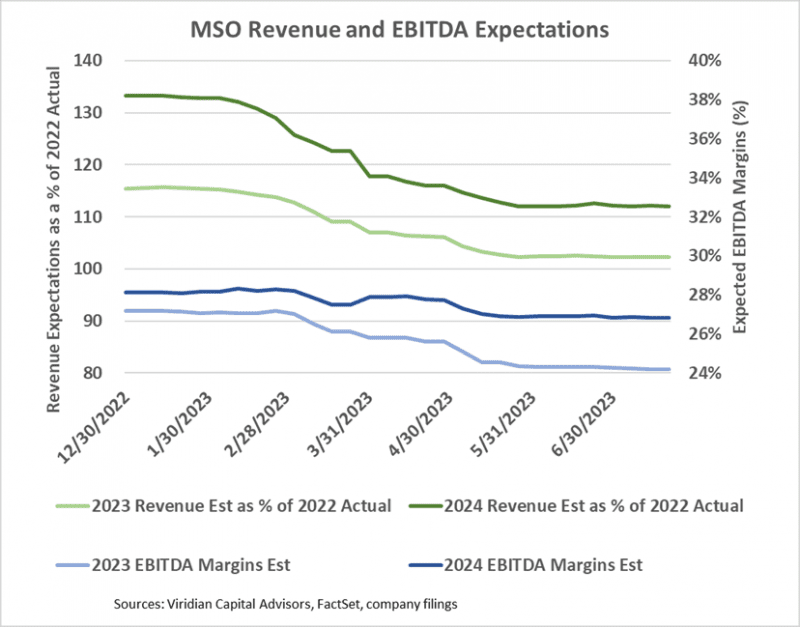
- The chart below looks at 2023 and 2024 revenue and EBITDA estimates. Once again, the 2023 numbers do not look heroic: 2023 revenues for the group of ten largest MSOS are now only projected to be 2% higher than in 2022, and 2024 revenues are projected to be 12% higher than 2022 (a 5.8% CAGR). EBITDA margins are projected to drop from 25% in 2022 to 24% in 2023 before rebounding to 27% in 2024. Although we aren’t entirely comfortable with the 2024 margin expansion, we can’t say that the projections are super aggressive.
- Debt is now unsustainably high for many of the largest MSOs. Seven of the twenty-three U.S. MSOs with market caps over $20M have Debt/ Market Cap above 5x, a level we consider to be indicative of stress. We have previously shown similar results using debt/2024 EBITDA above 3x. The advantage of the measure in the graph below is that it can be calculated for any public company regardless of whether it has analyst coverage. Another advantage is that market leverage reacts to stock value changes.
- The companies with green bars extending over 3.0x Debt/ 2024 EBITDA appear to be overlevered.
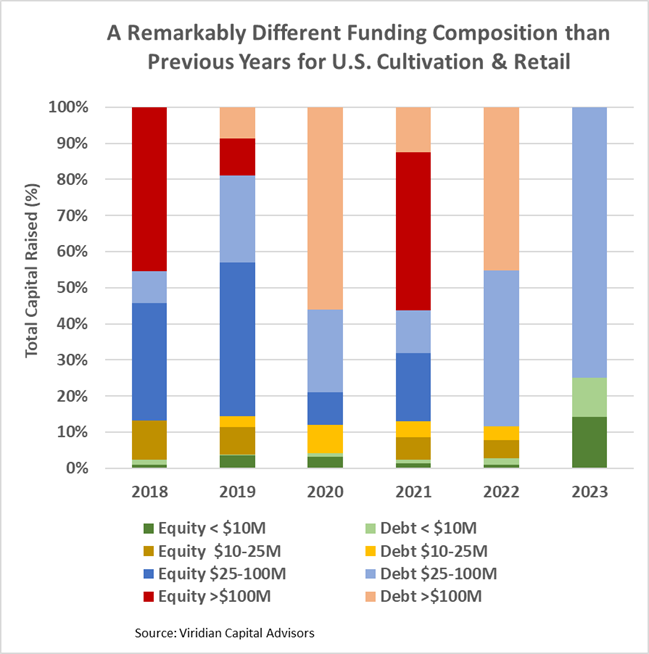
- YTD, U.S. Cultivation & Retail sector capital raises are down 77.7% from 2022 and are lower than any previous comparable period since before 2018.
- Debt is still the dominant form of funding, accounting for 85.7% of all cultivation sector capital raised. 15.6% of the debt raised YTD has been for private companies.
- Large transactions are still absent from the market. There have been no debt or equity deals over $100M YTD. The graph below shows the strikingly different composition of U.S. Cultivation & Retail capital raises in 2023 compared to previous years, with small equity and midsized debt dominating raises.
- Cannabis equities (as measured by the MSOS ETF) were unchanged for the week.
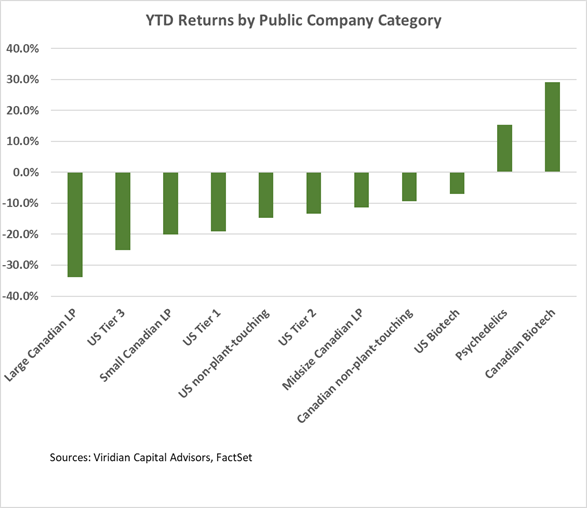
YTD Returns by Public Company Category
- Only two of our eleven categories have registered positive returns YTD. Psychedelics, were leading last week but dropped back to second place due to the 9.8% weekly decline in GH Research (GHRS: Nasdaq) ad the 13.1% decline in Cybin (CYBN: Nasdaq).
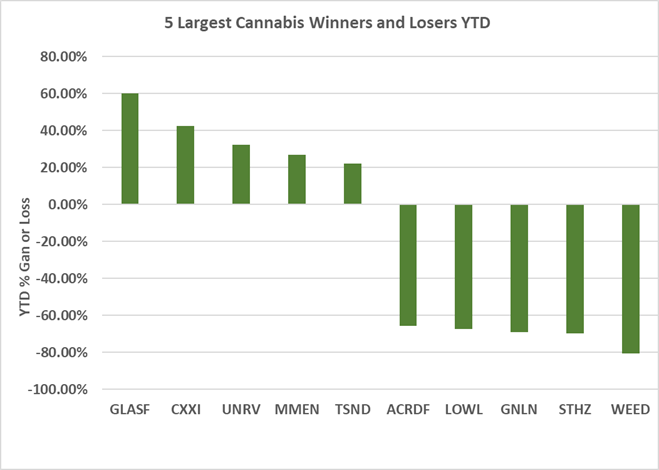
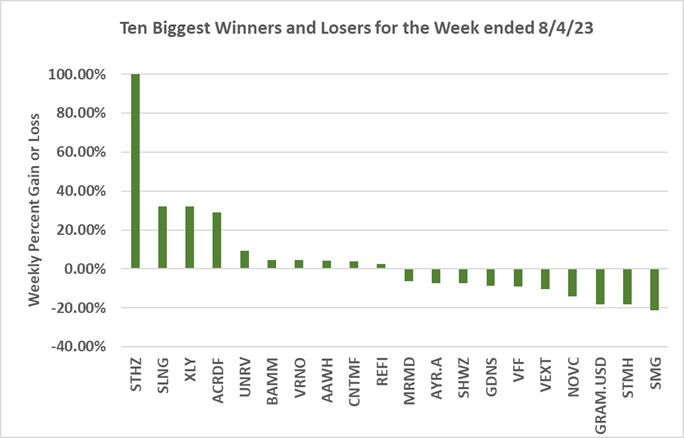
Best and Worst Performers of the last week and YTD:
- StateHouse (STHZ: CSE)(STHZF: OTCQX) was the best performer of the week, gaining 197% to 0.022 on its Pelorus facility’s successful enlargement and extension. The stock is still about 40% lower than two weeks ago and remains our second-biggest loser YTD.
- Auxly (XLY: CSE) was another strong performer, up 32% on the news that it had received a two-year extension of the maturity of its senior secured convertible debentures to September 24, 2026. The debentures are held by a wholly owned subsidiary of Imperial Brands and are convertible into 13.6% of the company’s fully diluted shares. Auxly also announced the resignations of its CFO and the Board designee of Imperial and reiterated the significant doubt that it can continue as an ongoing business.
- Scott’s Miracle Grow (SMG: Nasdaq) was the week’s biggest loser, down 21.3% on reduced 2023 guidance and significant insider sales.