OUR 9TH YEAR OF PROVIDING PROPRIETARY CAPITAL MARKETS INTELLIGENCE ON THE CANNABIS / HEMP / PSYCHEDELIC SECTORS
Each week, Viridian publishes insights and analysis on completed capital raise transactions in the prior week, focusing on all equity and debt deals. Our analysis includes:
- Summary
- Outlook
- Best & Worst Perfromers
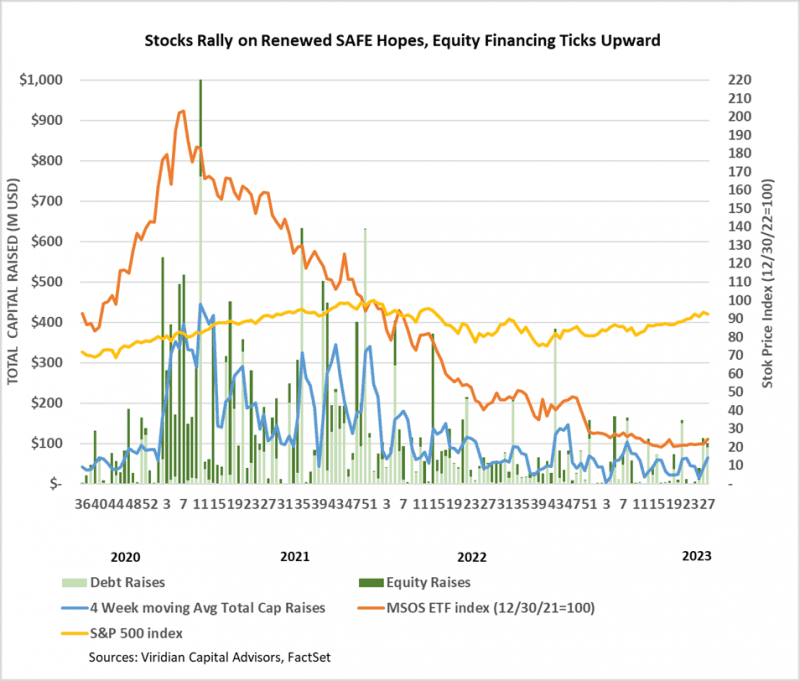
- Cannabis capital raises are off to a multi-year low. Only $1.30B closed through the first twenty-seven weeks of the year compared to $2.66B last year.
- Debt represents 67.9% of total capital raised, significantly higher than in any other comparable period since 2018.
- Public companies have raised 71.8% of total capital YTD, down from 73.0% last year and lower than any comparable period since 2019.

VIRIDIAN INSIGHTS
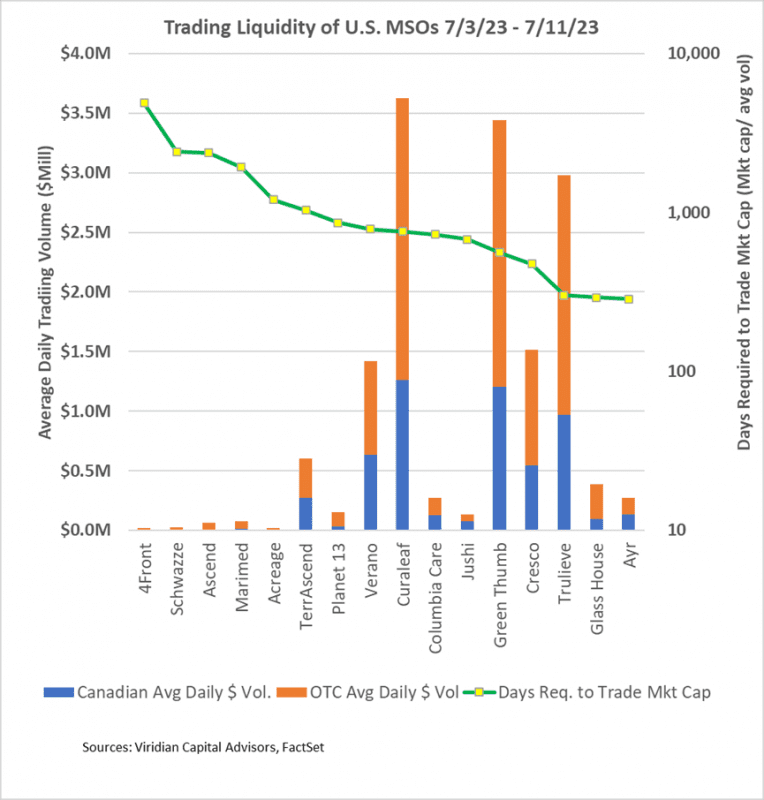
- July 3, 2023, TerrAscend Corp. (TER: CSE)(TRSSF: OTCQX) began to trade on the TSX exchange. Its first day of trading on July 4 wasn’t a fair test, but for the record, the company traded approximately 50.8k shares at average prices of about $1.82 for a dollar volume of around $92.5K
- The graph below shows updated evidence of the stock trading volume and relative liquidity of U.S. MSOs since July 3, 2023. The charts’ bars indicate the average daily dollar trading volume for the first half of 2023. The blue bars indicate Canadian volumes (CSE for all companies except TSND), while the orange bars indicate OTC volumes. Interestingly, every company (including TSND) had a higher dollar trading volume on OTC than on Canadian exchanges.
- The green line shows the company’s market cap divided by the average daily dollar volume, the number of days it would take to trade its market cap.
- TerrAscend has made some progress regarding its trading volume and liquidity, but the results are not remarkable. For the first six months of the year, the company had the second-highest days to trade market cap (worst liquidity) of 1,412 days, and this has now improved to the sixth highest at 1034 days. TerrAscends’ average daily volume has been enhanced from $.44M to $.60M but still ranks as the 11th of 16 companies on the chart. TerrAscend is correct to worry about the trading liquidity of its stock. This is hardly the revolutionary change in liquidity that some observers had forecasted, but to be fair, it is still the early days for TSND on the TSX. We will be watching closely.
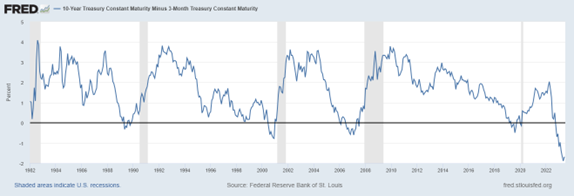
- The three-month-10-year spread remains more inverted than any period over the previous 40 years, pointing solidly toward recession. The market is misreading Powell’s true intentions; reducing goods and services inflation is only one of his goals and perhaps not the most important one. Powell aims to deflate the all-asset bubble that a decade of zero interest rates established, and it seems pretty clear that it will take a recession to do that. The alternative is to back off prematurely and live with stagflation, which may be even more damaging in the long term.
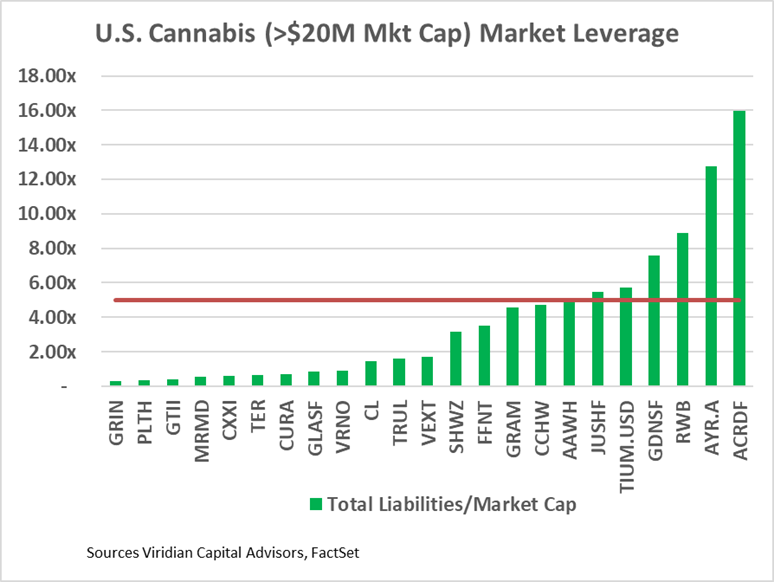
- Debt is now unsustainably high for many of the largest MSOs. Seven of the twenty-three U.S. MSOs with market caps over $20M have Debt/ Market above 5x, a level we consider to be indicative of stress. We have previously shown similar results using debt/2024 EBITDA above 3x. The advantage of the measure in the graph below is that it can be calculated for any public company regardless of whether it has analyst coverage. Another advantage is that market leverage reacts to stock value changes like the current week’s jump.
- The companies with green bars over the red line appear to be overleveraged. However, in some cases, a high market leverage might indicate that the stock is relatively undervalued.
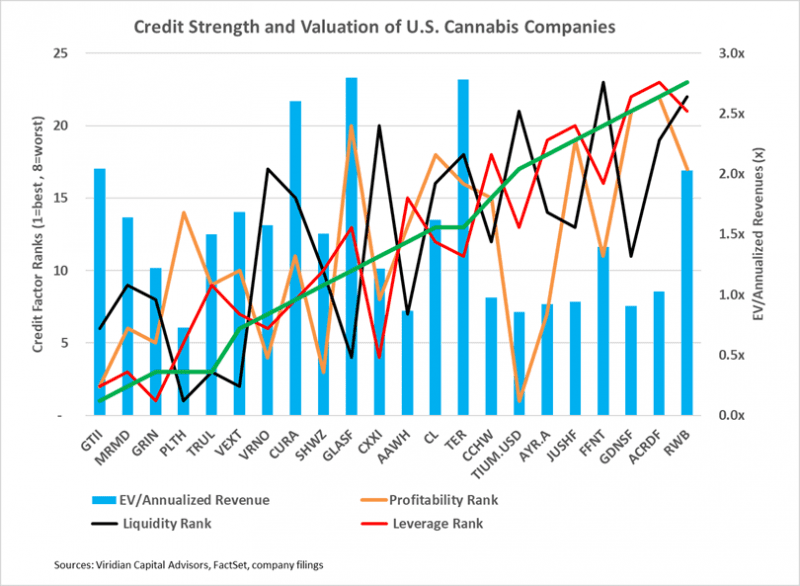
- The graph below takes a more integrated view of cannabis credit using the Viridian Credit model, augmented by a valuation metric, EV/ annualized revenues.
- The cannabis equity window appears to be opening up. But companies’ experience in approaching the market can diverge widely. This week’s two closed equity issues by Ascend (AAWH: CSE)(AAWH: OTC) and Greenlane (GNLN: Nasdaq) demonstrate the point. Ascend $7M issue contain no punishing warrants and was received warmly by the market, and has continued to trade up since issuance. Greenlane faced a far more hostile reception and had to include two five-year warrants with a 0% premium to complete its $4.25M deal. The warrants are quite valuable and represent a large discount to the net share price of the offering. The shares plunged after the deal was announced and have not recovered. The moral of the story is that deal structure matters, and this is no market to try to push through a deal with a lukewarm reception.
- YTD, U.S. Cultivation & Retail sector capital raises are down 77.5% from 2022.
- Debt is still the only game in town, accounting for 85.7% of all cultivation sector capital raised. 15.6% of the debt raised YTD has been for private companies.
- Large transactions are still absent from the market. There have been no debt or equity deals over $100M YTD. The graph below shows the strikingly different composition of U.S. Cultivation & Retail capital raises in 2023 compared to previous years, with small equity and midsized debt dominating raises.

- Cannabis equities (as measured by the MSOS ETF) were up 12.82% for the week.
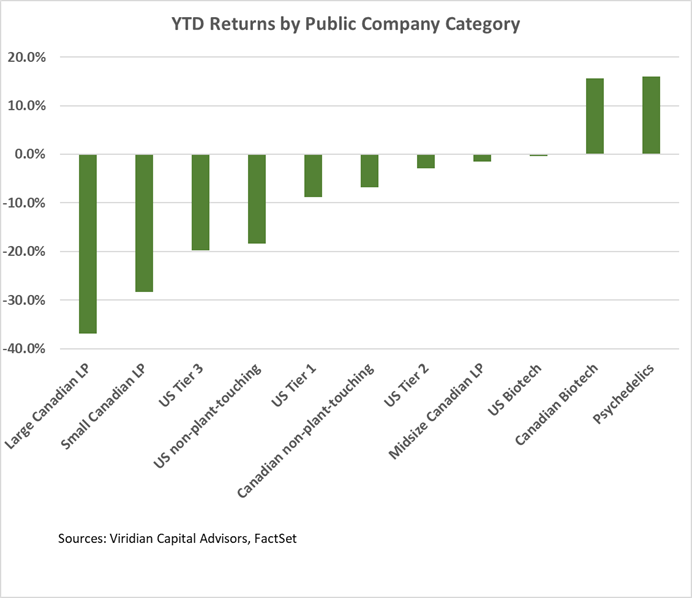
YTD Returns by Public Company Category
- The biggest change from last week was the increase in performance in the Psychedelic sector. ATAI (ATAI: Nasdaq), Compass (CMPS: Nasdaq), Cybin (CYBN: Nasdaq), and Mindset (MSET: CSE) were all up over 15%, making the sector the top performer YTD.
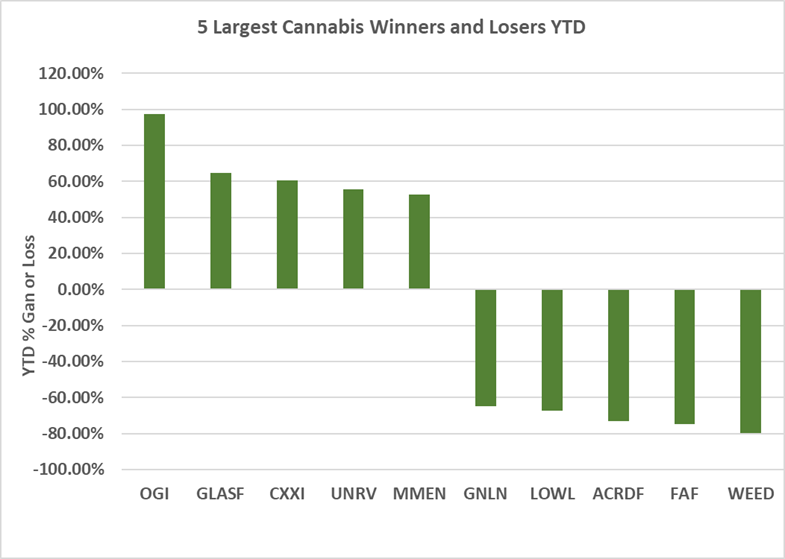
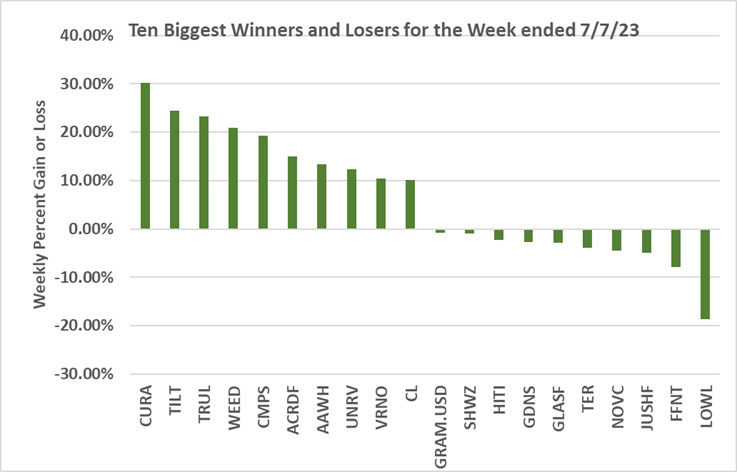
Best and Worst Performers of the last week and YTD
- We are surprised to see Jushi (JUSH: CSE)(JUSHF: OTC) on the week’s loser list, down 5.0%. Last week, Jushi reduced the strike price on its warrants to coax noteholders to remove their 105 change of control put. We thought the signaling impact of the takeover-friendly removal of change of control would outweigh the reduced strike price effect of increasing the fully-diluted share count.
- TerrAscend (TSND: Nasdaq)(TRSSF: OTCQX) was down 3.84% on what appeared to be a slew of positive news items. Possibly, investors were as unimpressed as we were about the increased volume from TSX trading.
- Finally, Lowell Farms (LOWL: CSE)(LOWLF: OTC), Glass House (GLAS.A: NEO)(GLASF: OTCQX), and 4Front (FFNT: CSE)( FFNT: OTCQX) all appeared on the loser list with a common factor of California and secondary factor of high leverage. 4Front has also been deteriorating in the Viridian Capital credit model.
- Curaleaf (CURE: CSE)(CURLF: OTCQX) was the biggest gainer, up 30.16% on the week after rumors cited it as a potential buyer of Cronos (CRON: Nasdaq)(CRON: TSX). We don’t see the allure of Cronos, whose market cap is less than its March cash balance. If you could buy Cronos for stock and take back notes, it might be a backdoor way of doing a big equity issue. It seems a bit too cute for our taste, but we also note that Cureleaf bonds have also caught a solid bid and are bid richer than Trulieve’s (TRUL: CSE) debt of similar maturities.