OUR 9TH YEAR OF PROVIDING PROPRIETARY CAPITAL MARKETS INTELLIGENCE ON THE CANNABIS / HEMP / PSYCHEDELIC SECTORS
Each week, Viridian publishes insights and analysis on completed capital raise transactions in the prior week, focusing on all equity and debt deals. Our analysis includes:
- Summary
- Outlook
- Best & Worst Perfromers
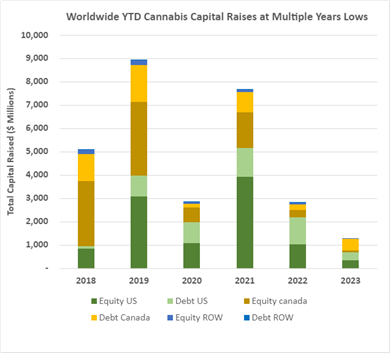
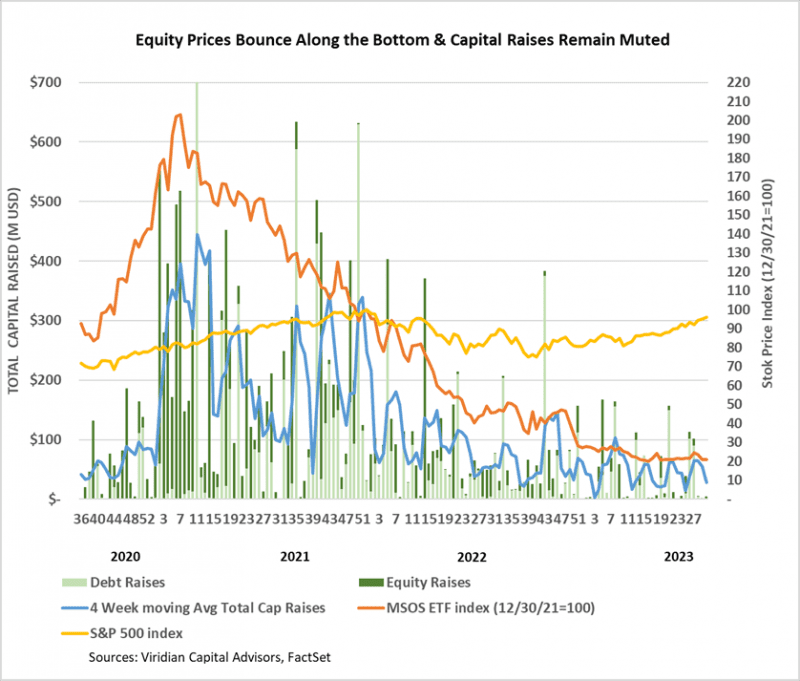
- Cannabis capital raises are off to a multi-year low. Only $1.31B closed through the first thirty weeks of the year compared to $2.82B last year.
- Debt represents 67.8% of total capital raised, significantly higher than in any other comparable period since 2018.
- Public companies have raised 72.1% of total capital YTD, down from 73.1% last year and lower than any comparable period since 2019.
VIRIDIAN INSIGHTS
Debt refinancing/restructuring is in the air!
- On August 1, 2023, StateHouse Holdings Inc. (STHZ: CSE)(STHZF: OTCQX) announced that it had modified and extended its Series A loan agreement agented by Pelorus Equity Group.
- Pelorus is providing an incremental term loan of $7.521M, bringing the size of the Series A loan to $15M and extending the maturity to February 10, 2027.
- The company had obtained nine previous amendments to the loan terms, with the final extension expiring on 7/31/23.
- The modified loan will carry interest at SOFR plus 12.5% with a 4.5% SOFR floor.
- The lenders also received 136,258,279 three-year warrants amounting to 40% warrant coverage at a calculated exercise price of $0.044 (a 46.7% premium to the closing price on August 1)
- The loan’s effective cost, including the warrants’ value, is approximately 18.4%. The cost is lower than expected, given our analysis of the StateHouse credit.
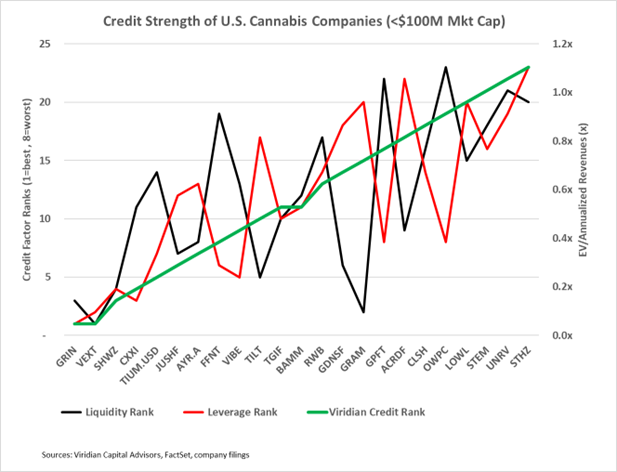
- StateHouse places at the bottom of the Viridian Capital Credit tracker model despite the boost to near-term liquidity that the loan extension provides. On March 31, 2023, the company had approximately $143M of debt against a current market cap of only $ 5.4 M. This extension does not cure its extremely over-levered balance sheet or lack of cash flow. Below is a chart that shows the liquidity, leverage, and overall credit ranking of the U.S. companies with under $100M in market cap.
Where’s the Volume?
- On July 3, 2023, TerrAscend Corp. (TER: CSE)(TRSSF: OTCQX) began to trade on the TSX exchange. Its first day of trading on July 4 wasn’t a fair test, but for the record, the company traded approximately 50.8k shares at average prices of about $1.82 for a dollar volume of around $92.5K
- The graph below shows the total dollar trading volume on Canadian exchanges (blue bars) and OTCQX (orange bars) for the two weeks before and four and one half after TerrAscend’s TSX commencement on 7/3/23. There is not much of a pattern of increased volume here, and on fifteen of the twenty-one trading days since the switchover from CSE to TSX, the company traded more volume on the OTCQX than on the TSX. We.0 do see two significant spikes. The larger of the two happened on July 19. Dollar trading volume was $20.4M, about 38 times the company’s average What are we to make of that? And why did the trading occur on the OTCQX rather than the TSX? The other much smaller spike was on July 31, with a dollar volume of $1.69 million. More than $1M traded on the TSX for the first time.
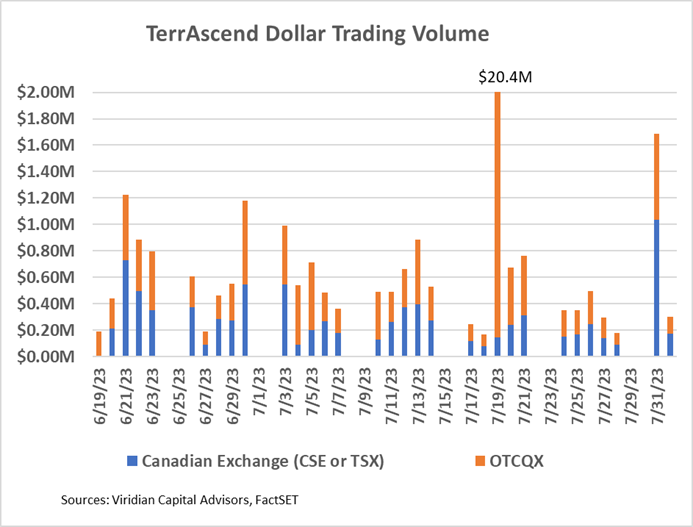
- Although it is still reasonably early to gauge the impact of the move to the TSX, many observers, us included, are scratching their heads at the modest impact that has been seen so far.
- Meanwhile, Curaleaf (CURA: CSE)(CURLF: OTCXQX) announced that it intends to be the second major MSO to list on the TSX. Curaleaf is a natural candidate with its robust European operations and should need fewer reorganization steps than most domestic operators. Moreover, CURA may better demonstrate the liquidity-increasing impact of the TSX since it has a much bigger float.
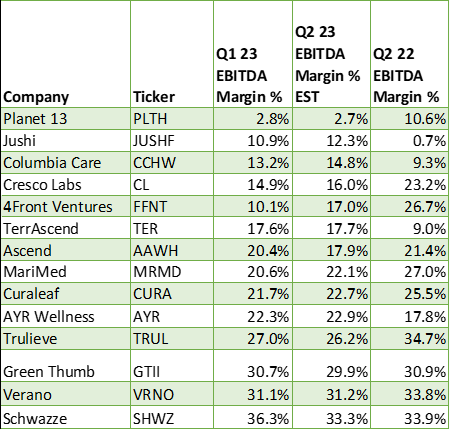
- Earnings season is approaching again, and the table below shows the EBITDA margins for Q1:23, Q2:23 projected, and Q2:22 for fourteen of the top MSOs. As expected, most companies have higher projected margins for the second quarter, primarily because it is a seasonally stronger quarter. Most companies also have weaker expected margins for Q2:23 than last year’s quarter, also expected due to the negative impacts of wholesale price compression matched with inflationary cost increases. The outliers to these trends were fascinating. See the Chart of the Week for more detail. We will pay close attention to estimate revisions after the results are released.
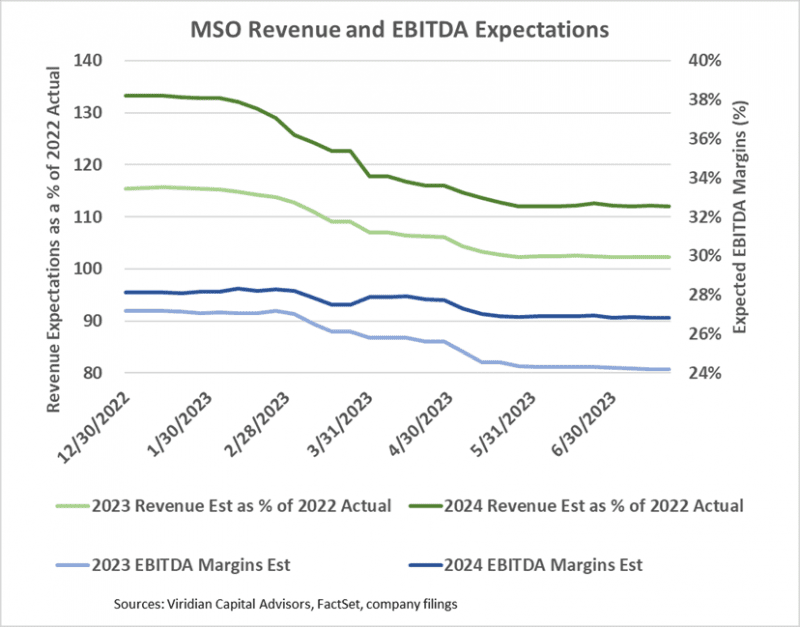
- The chart below looks at 2023 and 2024 revenue and EBITDA estimates. Once again, the 2023 numbers do not look heroic: 2023 revenues for the group of ten largest MSOS are now only projected to be 2% higher than in 2022, and 2024 revenues are projected to be 12% higher than 2022 (a 5.8% CAGR). EBITDA margins are projected to drop from 25% in 2022 to 24% in 2023 before rebounding to 27% in 2024. Although we aren’t entirely comfortable with the 2024 margin expansion, we can’t say that the projections are super aggressive.
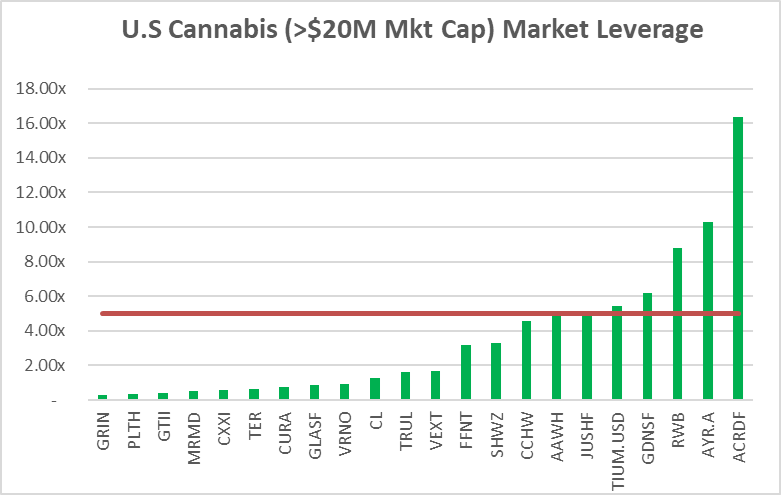
- Debt is now unsustainably high for many of the largest MSOs. Seven of the twenty-three U.S. MSOs with market caps over $20M have Debt/ Market Cap above 5x, a level we consider to be indicative of stress. We have previously shown similar results using debt/2024 EBITDA above 3x. The advantage of the measure in the graph below is that it can be calculated for any public company regardless of whether it has analyst coverage. Another advantage is that market leverage reacts to stock value changes.
- The companies with green bars over the red line appear to be overleveraged.
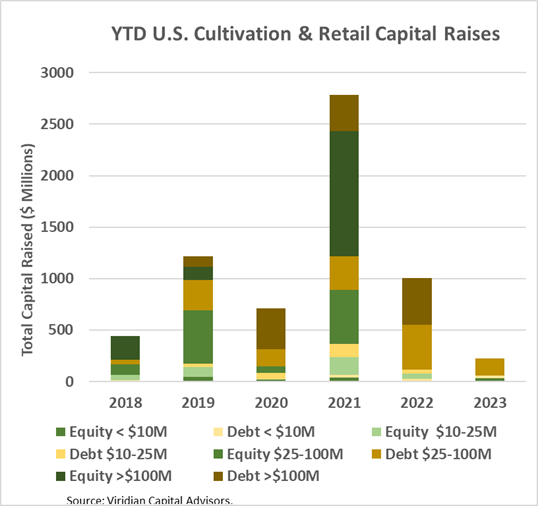
- YTD, U.S. Cultivation & Retail sector capital raises are down 77.7% from 2022 and are lower than any previous comparable period since before 2018.
- Debt is still the dominant form of funding, accounting for 85.7% of all cultivation sector capital raised. 15.6% of the debt raised YTD has been for private companies.
- Large transactions are still absent from the market. There have been no debt or equity deals over $100M YTD. The graph below shows the strikingly different composition of U.S. Cultivation & Retail capital raises in 2023 compared to previous years, with small equity and midsized debt dominating raises.
- Cannabis equities (as measured by the MSOS ETF) were up 0.75% for the week.
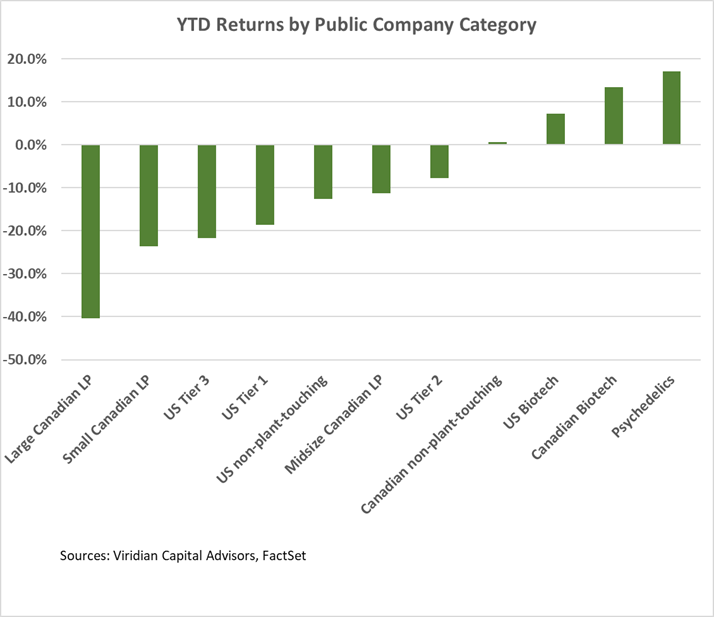
YTD Returns by Public Company Category
- Psychedelics are now the best-performing category of public companies in our ranking.
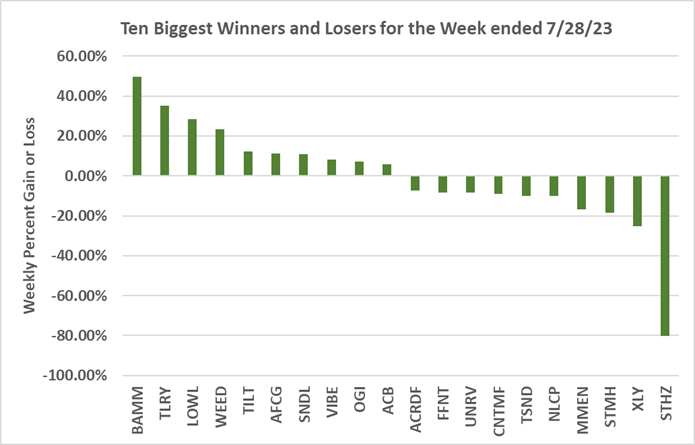
Best and Worst Performers of the last week and YTD:
- StateHouse (STHZ: CSE)(STHZF: OTCQX) was the worst performer of the week, dropping to $0.01 on Friday on fears that its loan would not be extended. The stock has recovered to around $0.03 after Pelorus extended and enlarged the facility.
- Body & Mind (BAMM: CSE) was the best performer of the week after announcing a sale of an Ohio dispensary to Farmaceuticalrx for upfront cash of $8.2M and contingent payments of $2.5M
- Tilray (TLRY: Nasdaq) was the second-best performer on better-than-expected earnings.