OUR 9TH YEAR OF PROVIDING PROPRIETARY CAPITAL MARKETS INTELLIGENCE ON THE CANNABIS / HEMP / PSYCHEDELIC SECTORS
Each week, Viridian publishes insights and analysis on completed capital raise transactions in the prior week, focusing on all equity and debt deals. Our analysis includes:
- Summary
- Outlook
- Best & Worst Perfromers
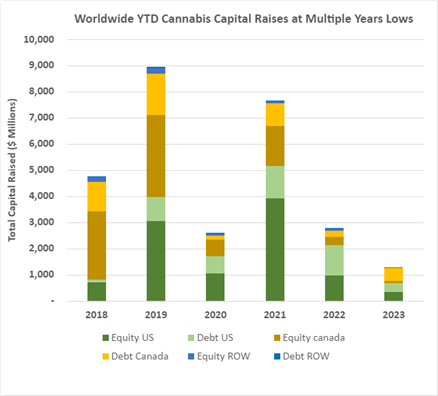
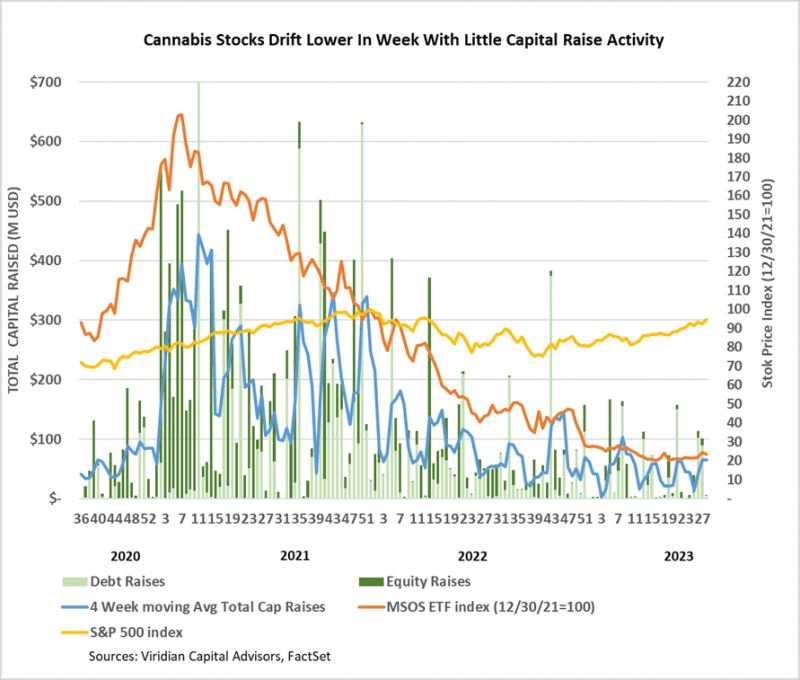
- Cannabis capital raises are off to a multi-year low. Only $1.31B closed through the first twenty-nine weeks of the year compared to $2.77B last year.
- Debt represents 68.1% of total capital raised, significantly higher than in any other comparable period since 2018.
- Public companies have raised 72.0% of total capital YTD, down from 72.5% last year and lower than any comparable period since 2019.
VIRIDIAN INSIGHTS
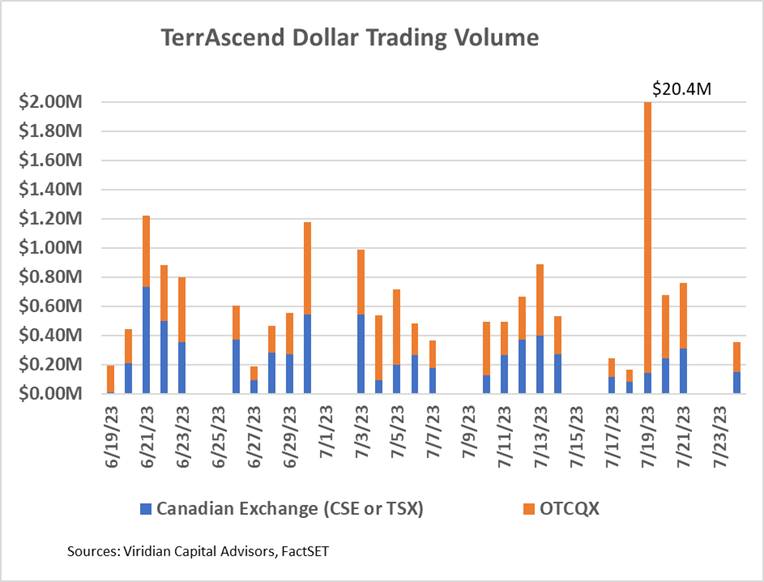
- July 3, 2023, TerrAscend Corp. (TER: CSE)(TRSSF: OTCQX) began to trade on the TSX exchange. Its first day of trading on July 4 wasn’t a fair test, but for the record, the company traded approximately 50.8k shares at average prices of about $1.82 for a dollar volume of around $92.5K
- TerrAscend has made some progress regarding its trading volume and liquidity, but the results are not remarkable. The graph below shows the total dollar trading volume on Canadian exchanges (blue bars) and OTCQX (orange bars) for the two weeks before and three after TerrAscend’s TSX commencement on 7/3/23. There is not much of a pattern of increased volume here, and on six of the ten trading days since the switchover from CSE to TSX, the company traded more volume on the OTCQX than on the TSX. The average daily trading volume of $.53M for the eleven days after the TSX listing (except for July 19) was lower than the $.65M average for the ten days before the TSX listing. But what happened on July 19? Dollar trading volume was $20.4M, about 38 times the average! What are we to make of that? And why did the trading occur on the OTCQX rather than the TSX?
- It is still the early days for TSND on the TSX. Morgan Stanley removed TSND from its restricted list and identified it as permissible to trade as of 7/5/23. We understand (but can’t confirm) that another major clearing bank made a similar move. We were skeptical that uplisting to the TSX would have that quick of an impact, but it is encouraging that it did.
- Meanwhile, Curaleaf (CURA: CSE)(CURLF: OTCXQX) announced that it intends to be the second major MSO to list on the TSX. Curaleaf is a natural candidate with its robust European operations and should need fewer reorganization steps than most domestic operators. Moreover, CURA may better demonstrate the liquidity-increasing impact of the TSX since it has a much bigger float.
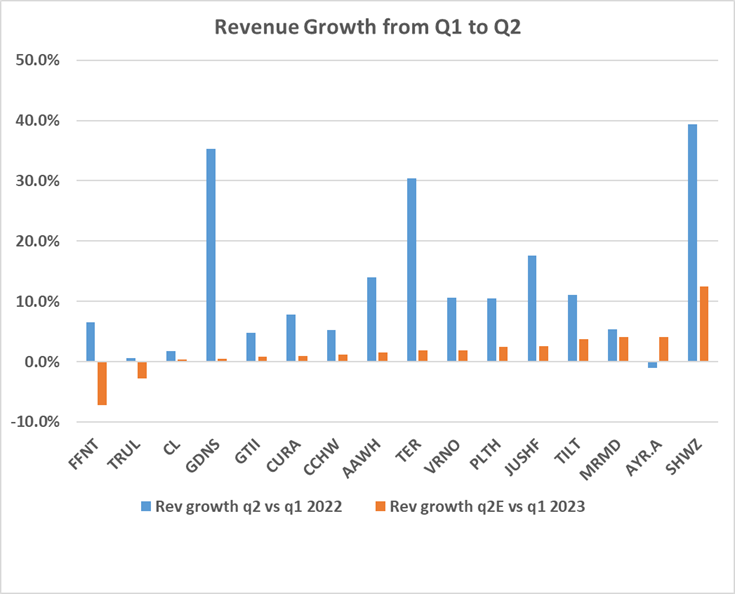
- Earnings season is approaching again, and the charts below show that analysts may have found religion. Q2 is usually a seasonally stronger quarter than Q1, and the blue bars on the graph below show the outsized revenue gains experienced in q2 2022 vs. q1 2022. Q1 2023 was seasonally weak, as expected. However, analysts are not projecting nearly as strong a bounce in q2 2023. While we don’t put much stock on quarterly earnings estimates, seeing a pattern of beats rather than misses would be encouraging.
- The chart below looks at 2023 and 2024 revenue and EBITDA estimates. Once again, the 2023 numbers do not look heroic: 2023 revenues for the group of ten largest MSOS are now only projected to be 2% higher than in 2022, and 2024 revenues are projected to be 12% higher than 2022 (a 5.8% CAGR). EBITDA margins are projected to drop from 25% in 2022 to 24% in 2023 before rebounding to 27% in 2024. Although we aren’t entirely comfortable with the 2024 margin expansion, we can’t say that the projections are super aggressive.

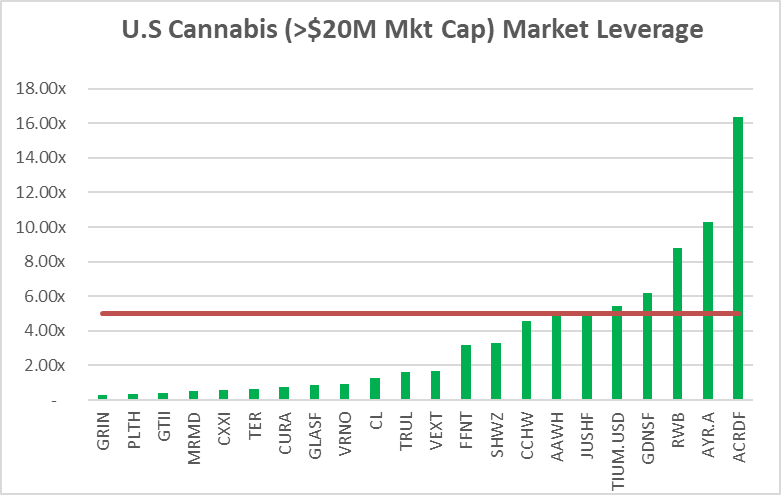
- Debt is now unsustainably high for many of the largest MSOs. Seven of the twenty-three U.S. MSOs with market caps over $20M have Debt/ Market Cap above 5x, a level we consider to be indicative of stress. We have previously shown similar results using debt/2024 EBITDA above 3x. The advantage of the measure in the graph below is that it can be calculated for any public company regardless of whether it has analyst coverage. Another advantage is that market leverage reacts to stock value changes.
- The companies with green bars over the red line appear to be overleveraged. The relative position of the companies on the chart has not changed significantly since last week, but AYR’s leverage is down by 2 points due to the significant rally in its stock.
- YTD, U.S. Cultivation & Retail sector capital raises are down 77.5% from 2022 and are lower than any previous comparable period since before 2018
- Debt is still the dominant form of funding, accounting for 85.7% of all cultivation sector capital raised. 15.6% of the debt raised YTD has been for private companies.
- Large transactions are still absent from the market. There have been no debt or equity deals over $100M YTD. The graph below shows the strikingly different composition of U.S. Cultivation & Retail capital raises in 2023 compared to previous years, with small equity and midsized debt dominating raises.

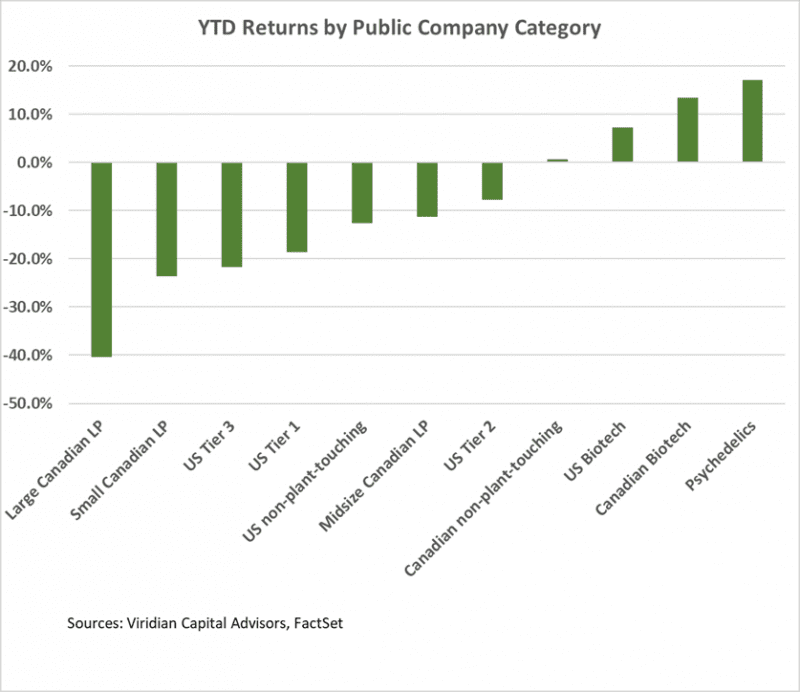
- Cannabis equities (as measured by the MSOS ETF) were down 11.00% for the week.
YTD Returns by Public Company Category
- There were no significant changes in the relative positions of public company categories this week despite the overall downturn in the market.
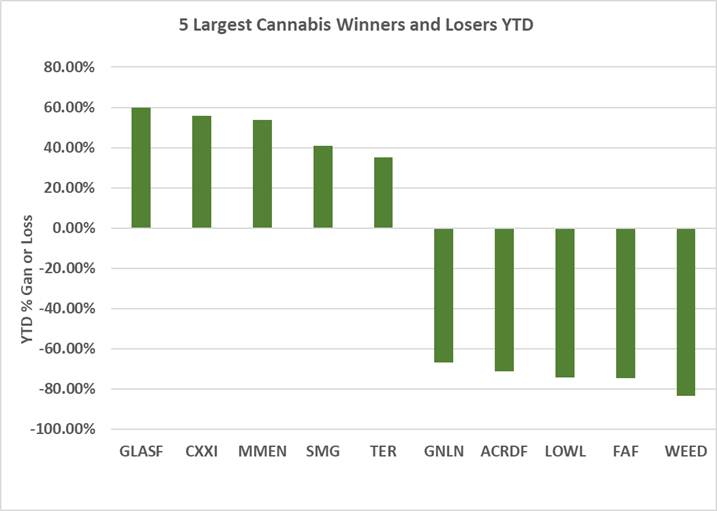
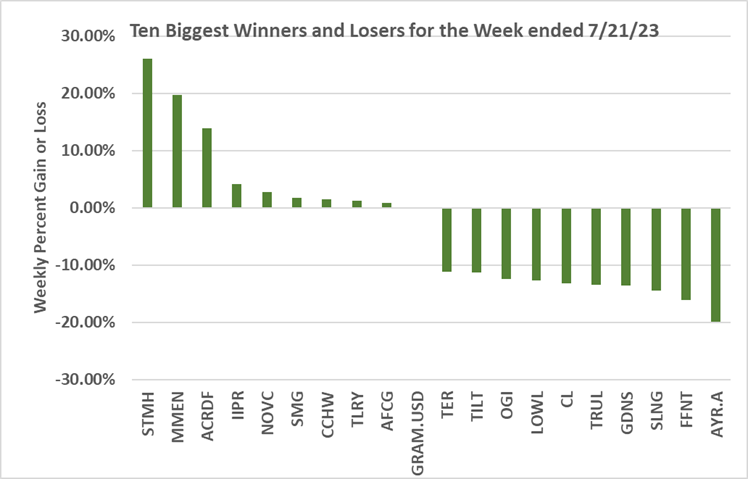
Best and Worst Performers of the last week and YTD
- AYR Wellness (AYR.A: CSE) was the week’s worst performer, down 21.18% on the news that SAFE would not make it to a vote this summer.
- 4Front (FFNT: CSE) was down 16.1%, joining AYR in whipsawing from being on the best performer list last week to the worst this week.
- Stem (STMH: OTC) and MedMen (MMEN: CSE) were up 26% and 20%, respectively, primarily trading as out-of-the-money options in an increased volatility trading week.