OUR 9TH YEAR OF PROVIDING PROPRIETARY CAPITAL MARKETS INTELLIGENCE ON THE CANNABIS / HEMP / PSYCHEDELIC SECTORS
Each week, Viridian publishes insights and analysis on completed capital raise transactions in the prior week, focusing on all equity and debt deals. Our analysis includes:
- Summary
- Outlook
- Best & Worst Perfromers
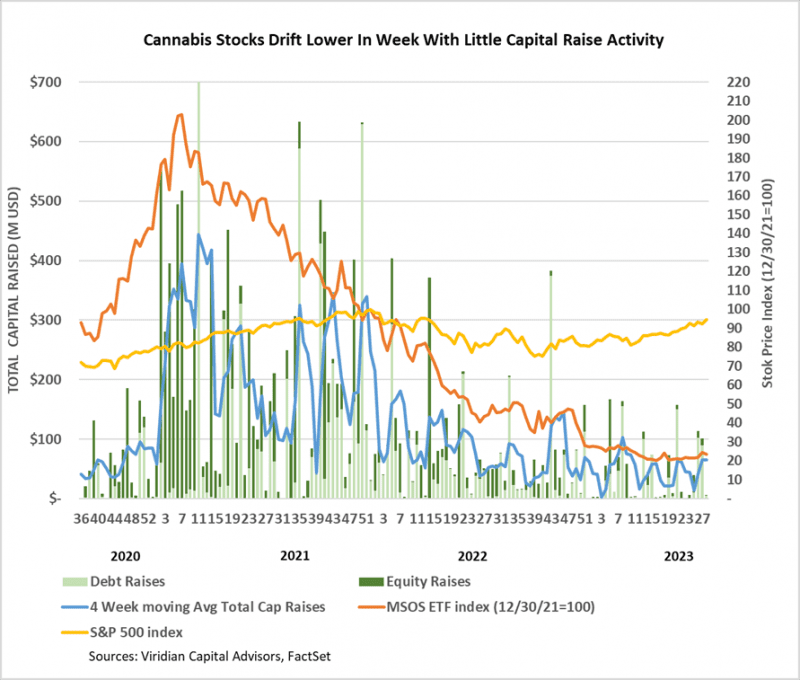
- Cannabis capital raises are off to a multi-year low. Only $1.30B closed through the first twenty-eight weeks of the year compared to $2.72B last year.
- Debt represents 68.0% of total capital raised, significantly higher than in any other comparable period since 2018.
- Public companies have raised 71.9% of total capital YTD, down from 73.5% last year and lower than any comparable period since 2019.

VIRIDIAN INSIGHTS
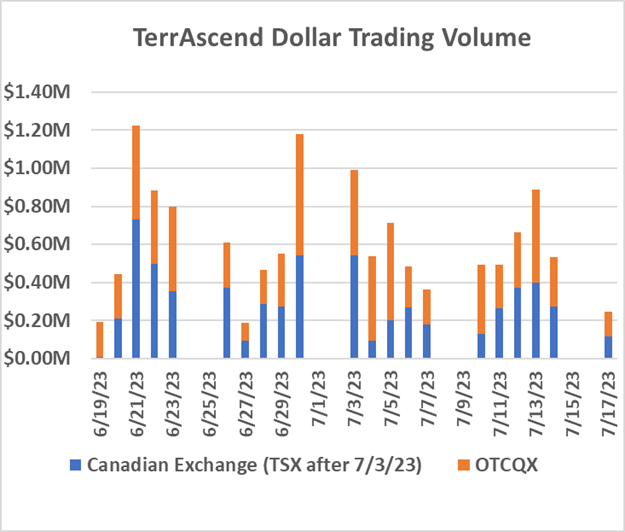
- July 3, 2023, TerrAscend Corp. (TER: CSE)(TRSSF: OTCQX) began to trade on the TSX exchange. Its first day of trading on July 4 wasn’t a fair test, but for the record, the company traded approximately 50.8k shares at average prices of about $1.82 for a dollar volume of around $92.5K.
- TerrAscend has made some progress regarding its trading volume and liquidity, but the results are not remarkable. The graph below shows the total dollar trading volume on Canadian exchanges (blue bars) and OTCQX (orange bars) for the two weeks before and after TerrAscend’s TSX commencement on 7/3/23. There is not much of a pattern of increased volume here, and on six of the ten trading days since the switchover from CSE to TSX, the company traded more volume on the OTCQX than on the TSX. The average daily trading volume of $.58M for the eleven days after the TSX listing was lower than the $.65M average for the ten days before the TSX listing.
-
- However, it is still the early days for TSND on the TSX. Morgan Stanley removed TSND from its restricted list and identified it as permissible to trade as of 7/5/23. We understand another major clearing bank is primed to make a similar move. We will monitor these actions’ impact on trading volume in the weeks ahead.
- Meanwhile, Curaleaf (CURA: CSE)(CURLF: OTCXQX) announced that it intends to be the second major MSO to list on the TSX. Curaleaf is a natural candidate with its robust European operations and should need fewer reorganization steps than most domestic operators.
- Red White & Bloom (RWB: CSE)(RWBYF: OTC) and Aleafia Health (AH: TSX)(ALEAF: OTCQB) mutually terminated their binding letter agreement concerning a proposed business combination. We can’t say we were surprised. Frankly, the idea of a financially weak U.S. operator purchasing an even weaker Canadian firm had us scratching our heads. RWB has repeatedly appeared near the bottom of our credit scoring system for U.S. operators, and Aleafia ranks even worse.
- One of the deal terms was canceling the roughly US$20M Aleafia unsecured convertible debt for a total payment of US$4.4M (about 22% of par). However, a block of at least 33% of the convert holders refused to go along. The convertible issue is split into three series with maturities in ’24, ’26, and ’28, and we do not know what terms were offered to each series. However, if we mark the ’28 maturity bond to a 25% yield, we get a price of around 50. With the offer side of the Columbia Care 9.5s of 26 at around a 24% YTM, Aleafia has to trade below 50. The converts are likely to be the fulcrum securities in what might be an Aleafia bankruptcy. On that basis, we calculated the following rough and ready valuation:

- The table above suggests that the convert holders were right to hold out. However, we aren’t sure they made the right decision after factoring in the need for a DIP facility, the time delay, and the potential for further deterioration of Aleafia’s business.
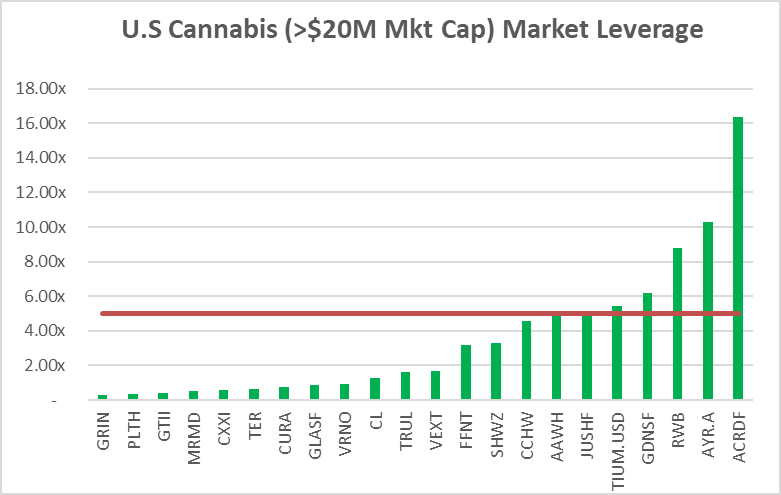
- Debt is now unsustainably high for many of the largest MSOs. Seven of the twenty-three U.S. MSOs with market caps over $20M have Debt/ Market Cap above 5x, a level we consider to be indicative of stress. We have previously shown similar results using debt/2024 EBITDA above 3x. The advantage of the measure in the graph below is that it can be calculated for any public company regardless of whether it has analyst coverage. Another advantage is that market leverage reacts to stock value changes.
- The companies with green bars over the red line appear to be overleveraged. The relative position of the companies on the chart has not changed significantly since last week, but AYR’s leverage is down by 2 points due to the significant rally in its stock.
- This week’s Grown Rogue debt deal proves that smaller companies in out-of-favor markets (Oregon & Michigan) can still raise money in the debt market. It was a more expensive deal for the company (effective yield of 23.5%) than we feel is warranted, but it is understandable with debt for companies like Curaleaf quoted in the mid to high teens.
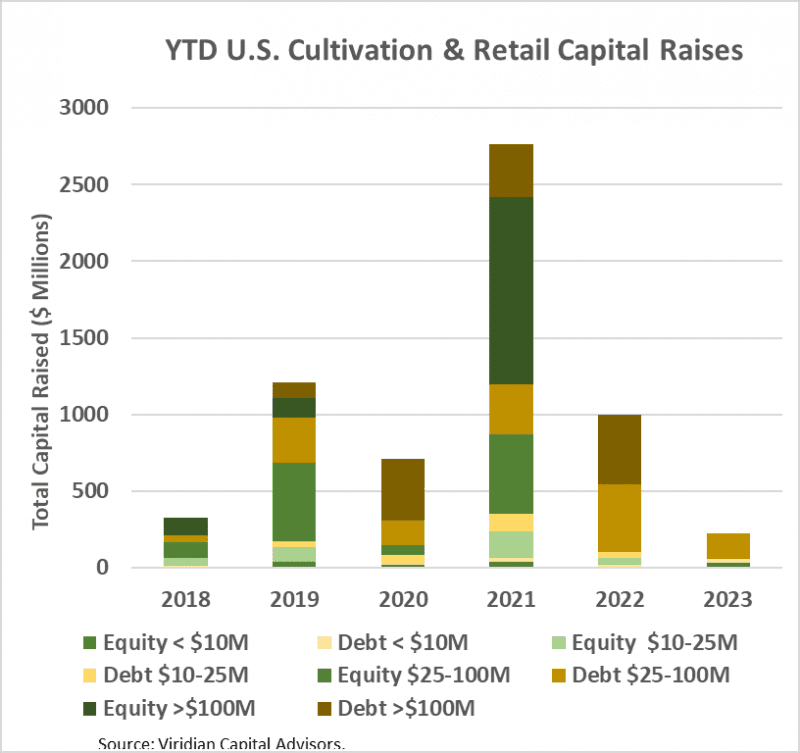
- YTD, U.S. Cultivation & Retail sector capital raises are down 77.5% from 2022 and are lower than any previous comparable period since before 2018.
- Debt is still the dominant form of funding, accounting for 85.7% of all cultivation sector capital raised. 15.6% of the debt raised YTD has been for private companies.
- Large transactions are still absent from the market. There have been no debt or equity deals over $100M YTD. The graph below shows the strikingly different composition of U.S. Cultivation & Retail capital raises in 2023 compared to previous years, with small equity and midsized debt dominating raises.
- Cannabis equities (as measured by the MSOS ETF) were down 4.00% for the week.
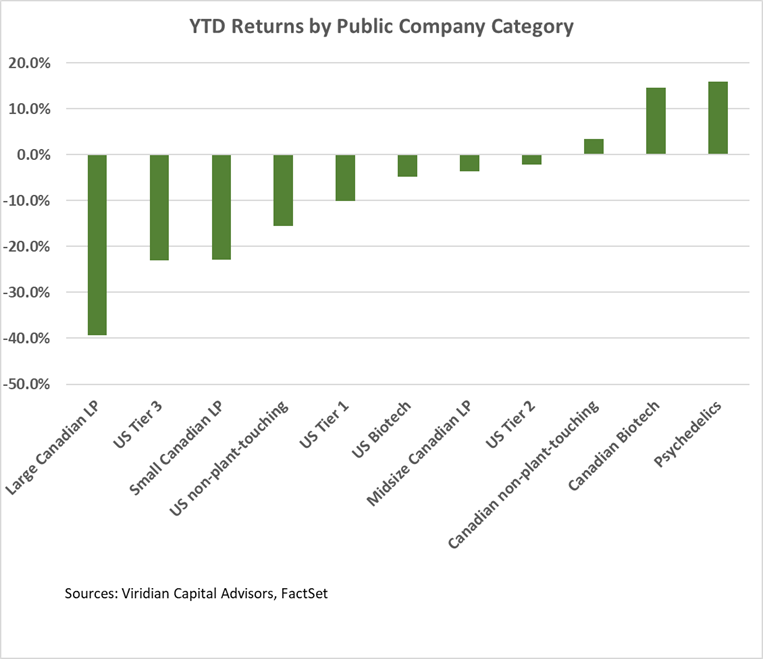
YTD Returns by Public Company Category
- There were no significant changes in the relative positions of public company categories this week.
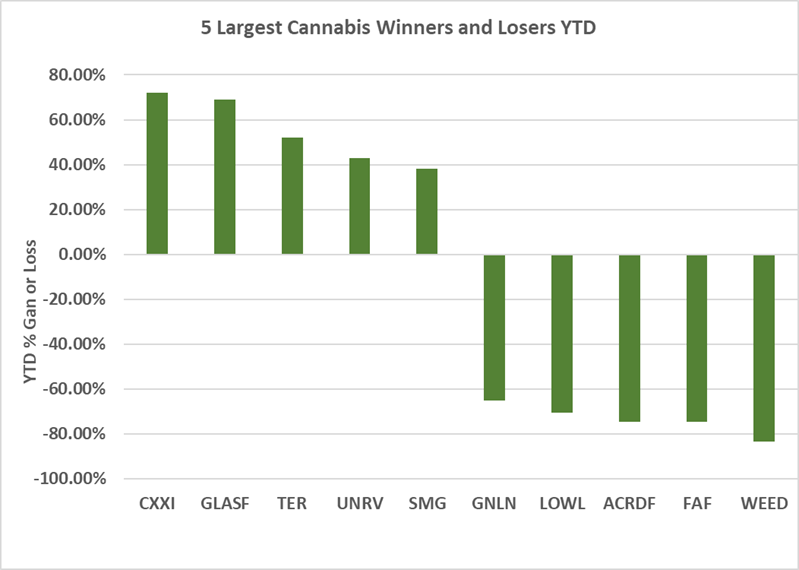
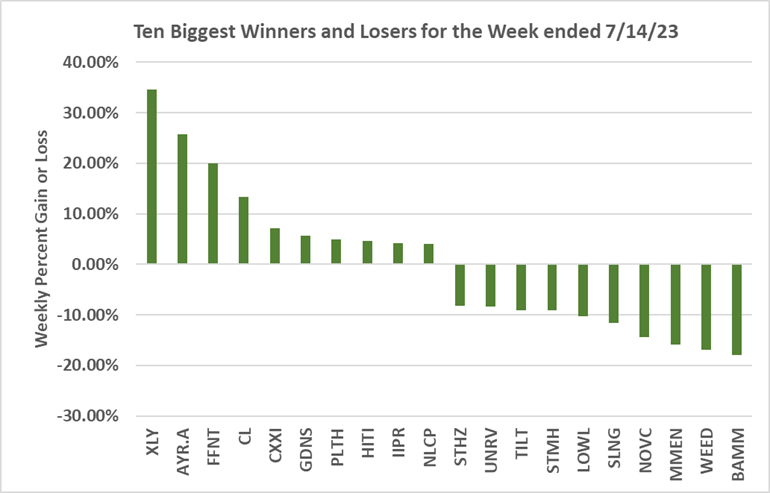
Best and Worst Performers of the last week and YTD
- AYR Wellness (AYR.A: CSE) was up 25.8% as investors perceive the stock’s liquidity troubles concerning its 2024 debt maturities to be survivable and its stock excessively cheap.
- 4Front (FFNT: CSE) gained 20.1% on the week in what appears to be a technical bounce. The stock has been pressured by California and the opening of its Big Daddy cultivation project, just when the Illinois wholesale market is showing some weakness.
- Body & Mind (BAMM: CSE) was the week’s big loser, down 18,0% on weak April quarter results.