OUR 9TH YEAR OF PROVIDING PROPRIETARY CAPITAL MARKETS INTELLIGENCE ON THE CANNABIS / HEMP / PSYCHEDELIC SECTORS
Each week, Viridian publishes insights and analysis on completed capital raise transactions in the prior week, focusing on all equity and debt deals. Our analysis includes:
- Summary
- Outlook
- Best & Worst Perfromers
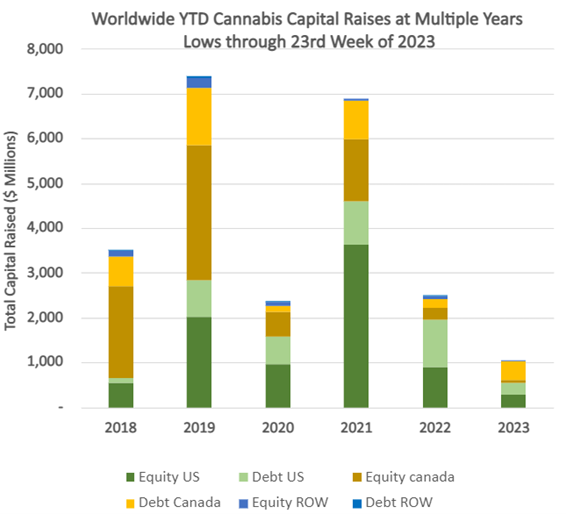
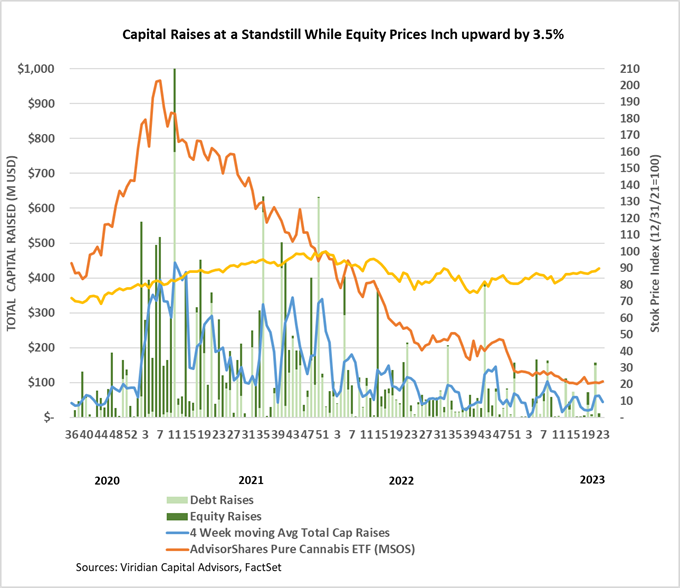
- Cannabis capital raises are off to a multi-year low. Only $1,040.31M closed through the first twenty-three weeks of the year compared to $2,495.54M last year.
- Debt represents 65.4% of total capital raised, significantly higher than in any other comparable period since 2018.
- Public companies have raised 67.3% of total capital YTD, down from 72.8% last year.
VIRIDIAN INSIGHTS
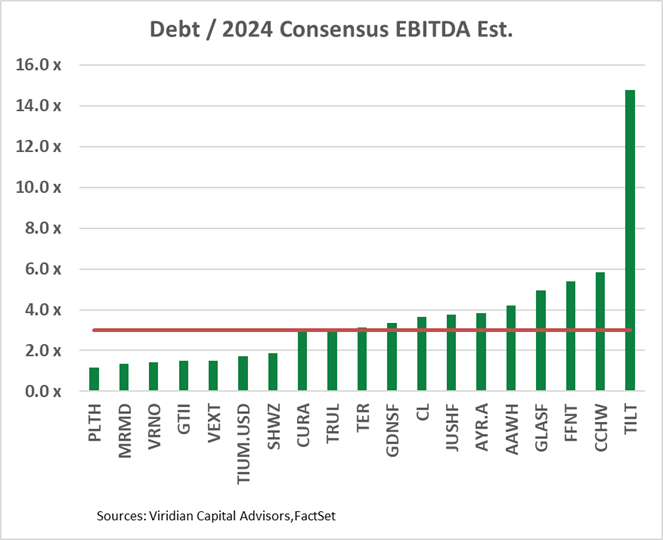
- Debt is now unsustainably high for many of the largest MSOs. Ten of the nineteen U.S. MSOs with market caps over $5M and sell-side analyst coverage now have Debt/ 2024 Consensus EBITDA estimates of over 3x. We have calculated 3x to be the approximate sustainable level of debt in the 280e environment using some simple math: If average interest rates equal 10% and effective tax rates on EBITDA equal 40%, then $1 of EBITDA for a company levered 3x debt/EBITDA will result in $.3 of free cash flow. The $3 of debt we assumed divided by the $.3 of FCF would give a payback period of 10 years!
- In this simplistic analysis, we have neglected growth, and some of the companies on the graph will be able to grow into their debt, given sufficient liquidity to do so. However, we have also neglected the capex and working capital increases needed to produce this growth.
- The companies on the graph significantly over the red line may have to contemplate a painful re-equitization to ensure their long-term survival.

- Can two bad credits combine to make one good one? This week, an interesting M&A deal was announced wherein Red White & Bloom (RWB: CSE) would acquire Aleafia Health (ALEAF: OTCQB) in an all-stock transaction.
- The deal is fascinating for several reasons:
- We have seen near-failing (and at least flailing) Canadian LPs buy or attempt to buy more successful U.S. MSOs (i.e., Canopy/TerrAscend/Acreage, etc.) but rarely do we see a U.S. MSO buy a failing Canadian competitor.
- Also interesting is that both companies are at the bottom of their respective market in terms of our appraisal of their credit quality.
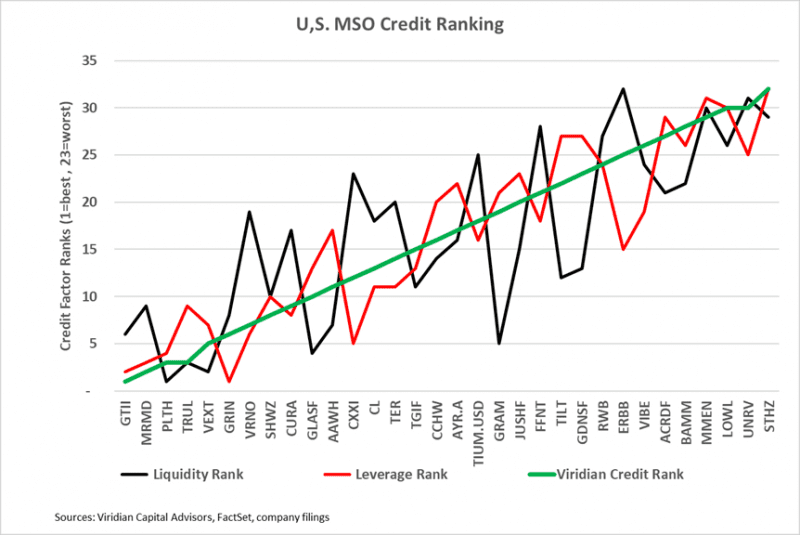
- RWB ranks 24/32 in our U.S. Cultivation & Retail companies rankings with over $5M market cap and sell-side analyst coverage. The company’s total liabilities to market cap of 8.9x is well into our danger zone, with significant maturities in 2024. RWB would rank even lower were it not for Lowell, Unrivalled, StateHouse, and MedMen holding a lock on the bottom slots.
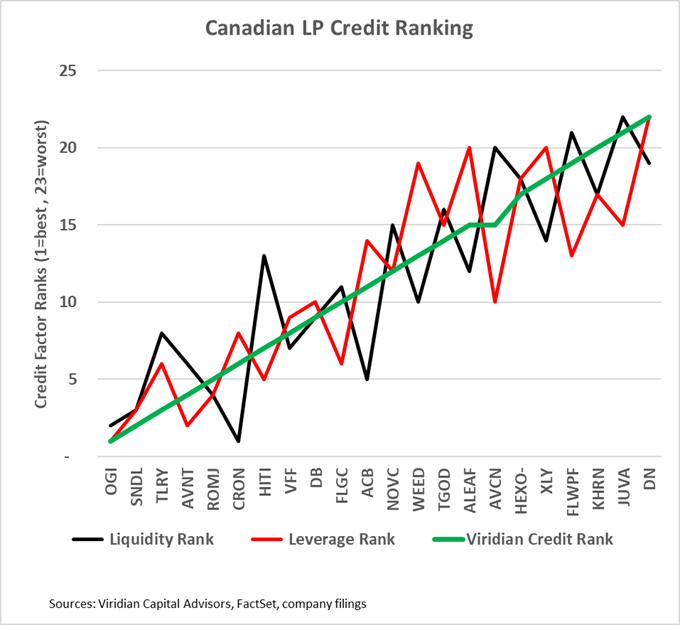
- Similarly, Aleafia ranks 16/22 in our Canadian rankings with the same parameters. It ranks 20/22 on leverage, and its Z-score of -11.4 signals a severe risk of failure.
- RWB plans to secure a $30M credit facility, the proceeds of which will pay off existing Aleafia and RWB debt. Frankly, we know of better credits than RWB having difficulty obtaining funding in the current market, and we will be looking with great anticipation to see who makes this loan.
- The graphs below show our rankings of the companies in the U.S. and Canadian markets arranged in descending order of credit quality.
- Rumors are swirling about a major California distributor facing severe financial problems. The proximate cause is the failure of several large dispensary chains to pay for their purchases, causing the distributor to be unable to pay its upstream brands/cultivators. We have no idea whether the story is true and won’t name names. Still, we find it fascinating because it shows the potential fragility of the system, where difficulties in one part of the ecosystem are transmitted to others. And just when it seemed safe to return to the California water.
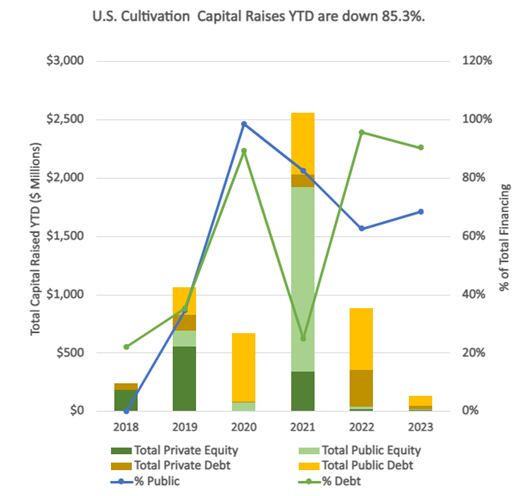
- YTD, U.S. Cultivation & Retail sector capital raises are down 85.3% from 2022.
- Debt is still the only game in town, accounting for 90.4% of all cultivation sector capital raised. All the debt raised YTD has been for public companies.
- Large transactions are still absent from the market. There have been no debt or equity deals over $100M YTD.
- Cannabis equities (as measured by the MSOS ETF) were up 3.54% for the week.
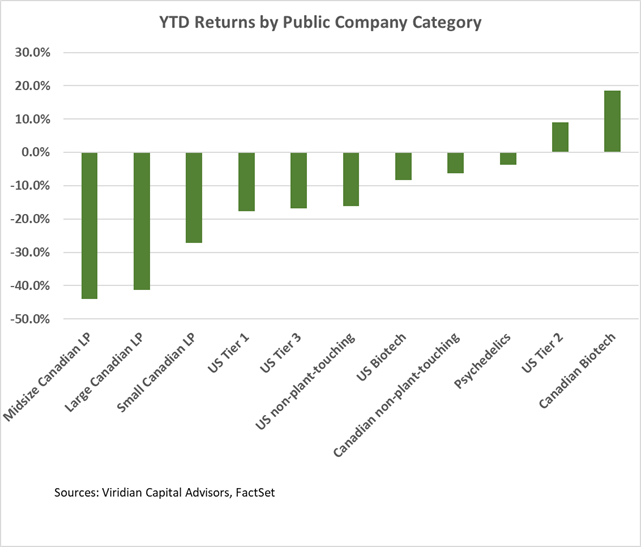
YTD Returns by Public Company Category
- The relative positioning of categories remained virtually unchanged from last week. U.S. Tier 2 became slightly more positive at a 2.9% gain YTD. The move was driven by a 13.9% weekly gain by Glass House (GLASF: OTC) and an 11.7% gain by Schwazze (SHWZ: OTC).
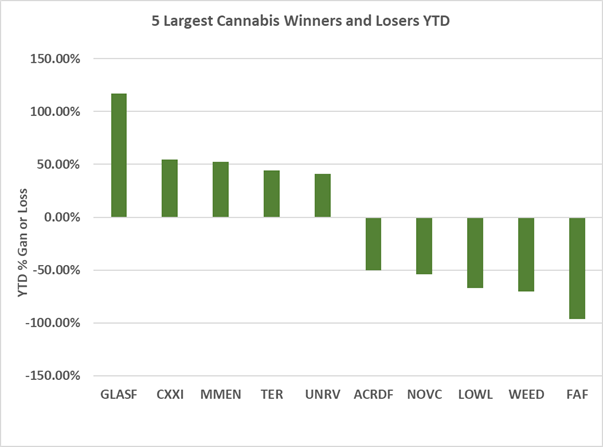
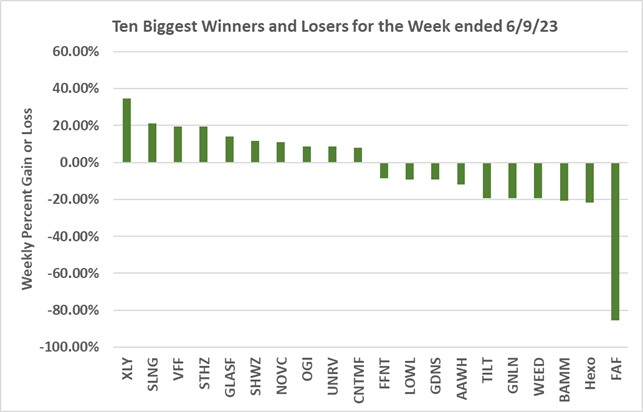
Best and Worst Performers of the last week and YTD
- Auxley (XLY: CSE) was the largest gainer, up 34.6%. We saw no news to account for the gain.
- Fire & Flower (FAF: CSE) was the week’s biggest loser, down 85.6% after its bankruptcy filing on June 6, 2023. An affiliate of Alimentation Couche-Tard (“Act”) provided a C$9.8M DIP loan. In April, FAF entered into a Master Licensing Agreement with a subsidiary of ACT, under which Couche Tard committed to developing Fire & Flower branded retail stores.