OUR 9TH YEAR OF PROVIDING PROPRIETARY CAPITAL MARKETS INTELLIGENCE ON THE CANNABIS / HEMP / PSYCHEDELIC SECTORS
Each week, Viridian publishes insights and analysis on completed capital raise transactions in the prior week, focusing on all equity and debt deals. Our analysis includes:
- Summary
- Outlook
- Best & Worst Perfromers
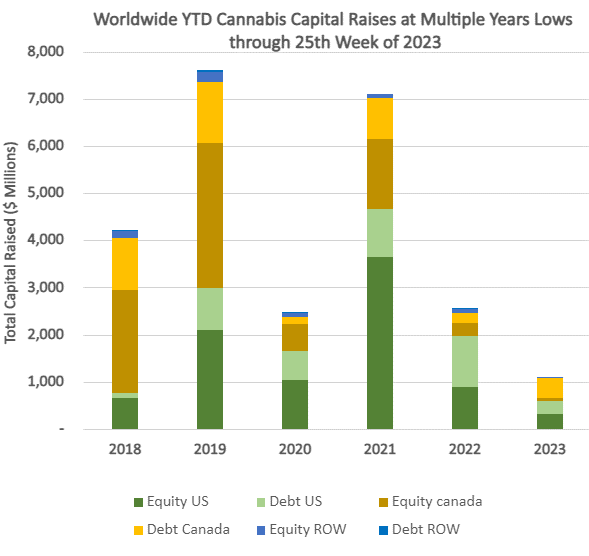
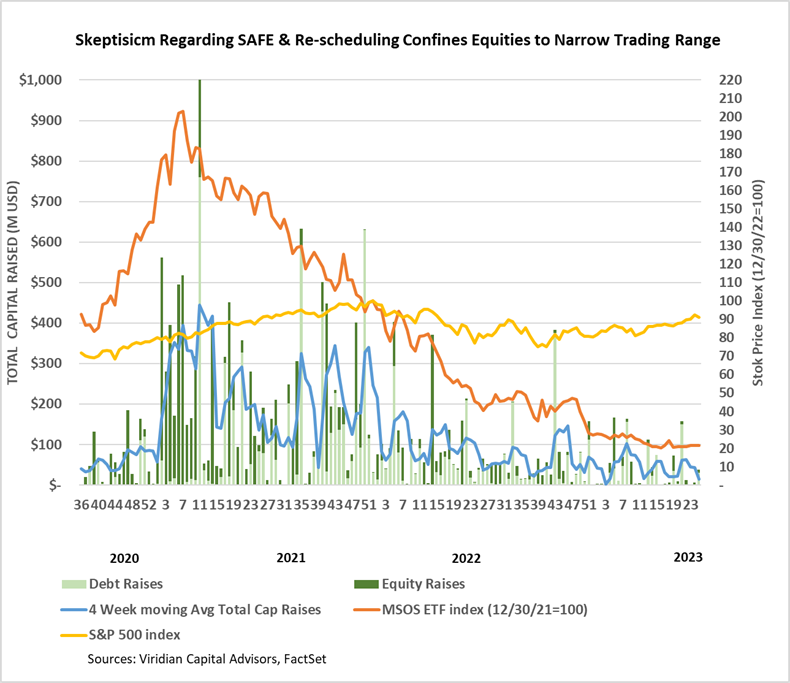
- Cannabis capital raises are off to a multi-year low. Only $1,085.31M closed through the first twenty-five weeks of the year compared to $2,547.37M last year.
- Debt represents 63.5% of total capital raised, significantly higher than in any other comparable period since 2018.
- Public companies have raised 66.2% of total capital YTD, down from 73.4% last year and lower than any comparable period since 2018.
VIRIDIAN INSIGHTS
- On June 21, 2023, TerrAscend Corp. (TER: CSE)(TRSSF: OTCQX) announced that it had received conditional approval from the Toronto Stock Exchange (TSX) to list its common shares on the TSX. Final approval is subject to the company meeting certain customary conditions by the exchange.
- TerrAscend believes listing on a senior exchange will increase its stock liquidity and attract additional investors.
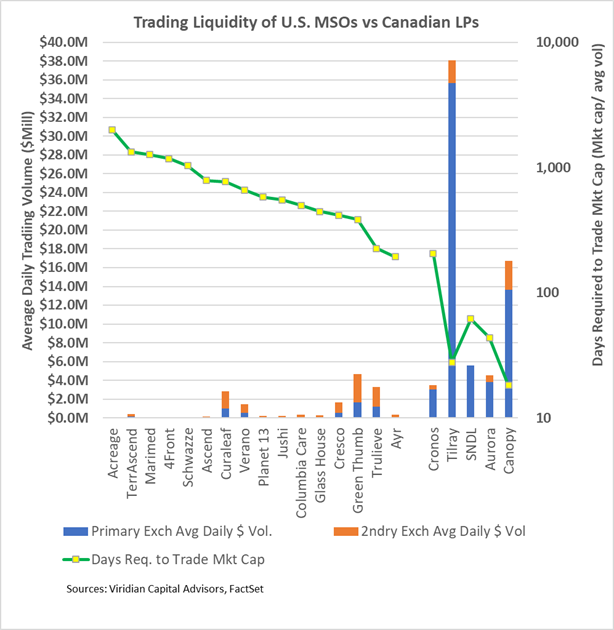
- The graph below shows updated evidence of the stock trading volume and relative liquidity of U.S. MSOs versus the top Canadian LPs. The blue bars on the chart indicate the average daily dollar trading volume YTD. For U.S. companies, we selected their CSE listing as the primary exchange. We chose Nasdaq as the primary exchange for Canadian companies and TSX as the secondary exchange.
- Surprisingly, all U.S. companies have significantly higher OTC volumes than CSE volumes.
- All of the U.S. companies except Green Thumb (GTII: CSE), Trulieve (TRUL: CSE), and Curaleaf (CURA: CSE) trade significantly less dollar volume than the Canadians.
- The green line shows the company’s market cap divided by the average daily dollar volume, the number of days it would take to trade its market cap. TerrAscend has the second highest measure (worst liquidity) with 1,331 days. TerrAscend is correct to worry about the trading liquidity of its stock. If an institutional investor had a position of 5% of TerrAscend ($29M) and wanted to trade out of it, assuming that he didn’t want to be more than 25% of the average daily dollar volume in the stock, it would take him 268 days get out.
- What is it about TerrAscend that has limited its volume to such a great extent? TerrAscend has 32% of Green Thumb’s market cap but only 9% of its dollar trading volume. One clue may come from the only company with worse liquidity, Acreage (ACRDF: OTC). What do the two of them have in common? Canopy! Other companies like Schwazze (SHWZ: CSE) with low liquidity suffer from the minimal public float in their stock.
- We believe that the discussion of uplisting has helped TerrAscend’s stock price, but we are not sure how much a TSX listing will pump up its dollar volume. After all, companies like Trulieve (TRUL: CSE) and AYR (AYR.A: CSE) are in the same ballpark on a days volume basis as Cronos (CRON: Nasdaq), and both of them trade over 60% of their average daily dollar volume on OTC. Perhaps uplisting to TSX in conjunction with SAFE or rescheduling might make a big difference, but we are skeptical that the TSX alone will make a big difference.
 The three-month-10-year spread became about 10bp more inverted over the last weeks. At -168 basis points, it is more inverted than any period over the previous 40 years, pointing solidly toward recession. Despite Powell’s hawkish rhetoric, the market is looking for a pivot. The market is misreading Powell’s true intentions; reducing goods and services inflation is only one of his goals and perhaps not the most important one. Powell aims to deflate the all-asset bubble that a decade of zero interest rates established, and it seems pretty clear that it will take a recession to do that. The alternative is to back off prematurely and live with stagflation, which may be even more damaging in the long term.
 The three-month-10-year spread became about 10bp more inverted over the last weeks. At -168 basis points, it is more inverted than any period over the previous 40 years, pointing solidly toward recession. Despite Powell’s hawkish rhetoric, the market is looking for a pivot. The market is misreading Powell’s true intentions; reducing goods and services inflation is only one of his goals and perhaps not the most important one. Powell aims to deflate the all-asset bubble that a decade of zero interest rates established, and it seems pretty clear that it will take a recession to do that. The alternative is to back off prematurely and live with stagflation, which may be even more damaging in the long term.
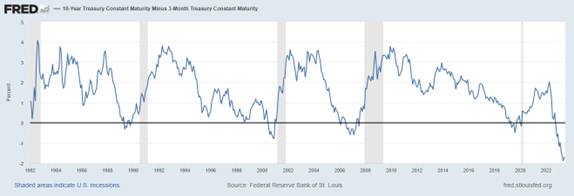
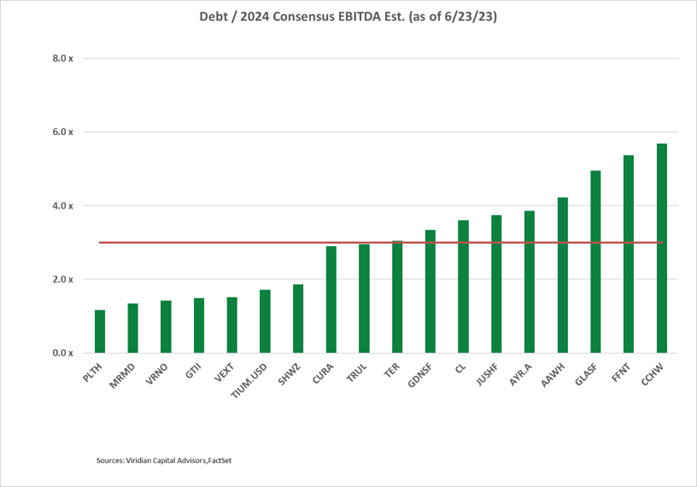
- Debt is now unsustainably high for many of the largest MSOs. Ten of the nineteen U.S. MSOs with market caps over $5M and sell-side analyst coverage now have Debt/ 2024 Consensus EBITDA estimates of over 3x. We have calculated 3x to be the approximate sustainable level of debt in the 280e environment using some simple math: If average interest rates equal 10% and effective tax rates on EBITDA equal 40%, then $1 of EBITDA for a company levered 3x debt/EBITDA will result in $.3 of free cash flow. The $3 of debt we assumed divided by the $.3 of FCF would give a payback period of 10 years!
- The companies on the graph significantly over the red line may have to contemplate a painful re-equitization to ensure their long-term survival.
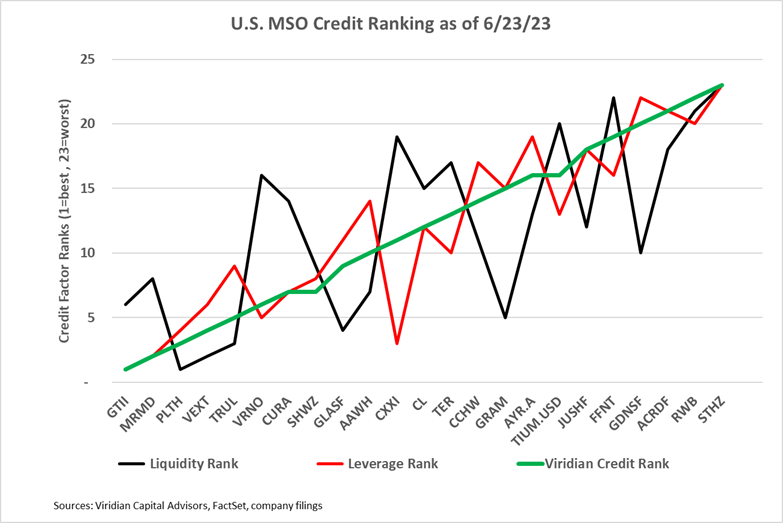
- The graphs below show our rankings of U.S. public MSOs arranged from left to right in descending order of credit quality. The most significant change since last week is the deterioration in Trulieve (TRUL: CSE) from the #3 to #5 ranking, primarily related to increased market leverage.
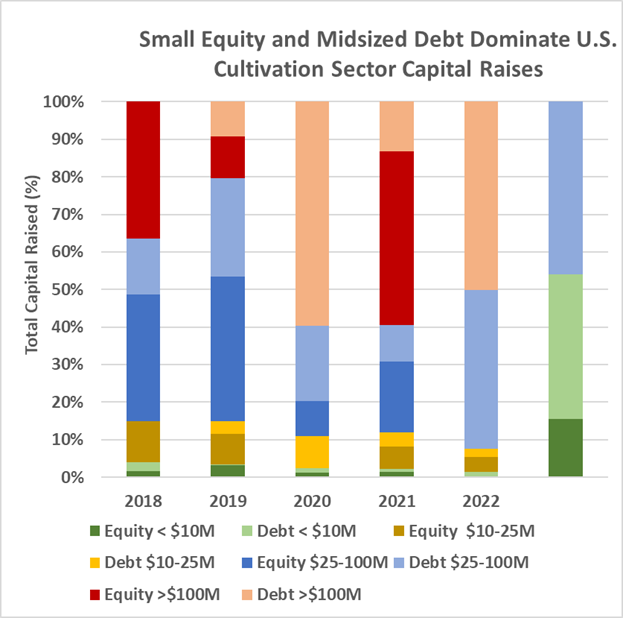
- YTD, U.S. Cultivation & Retail sector capital raises are down 83.7% from 2022.
- Debt is still the only game in town, accounting for 85.7% of all cultivation sector capital raised. 23.7% of the debt raised YTD has been for private companies.
- Large transactions are still absent from the market. There have been no debt or equity deals over $100M YTD.
- Cannabis equities (as measured by the MSOS ETF) were up .55% for the week.
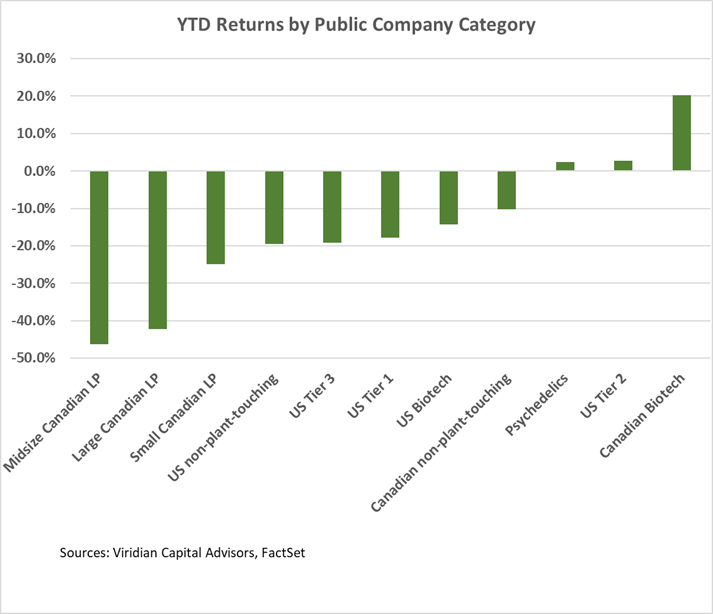
YTD Returns by Public Company Category
- The relative positioning of categories remained virtually unchanged from last week. U.S. Tier 2 rose to slightly positive performance YTD.
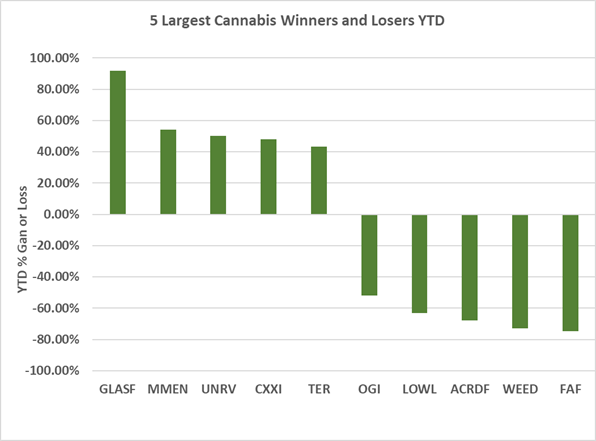
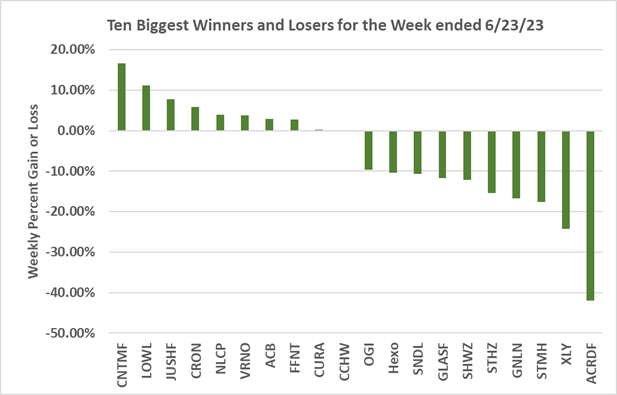
Best and Worst Performers of the last week and YTD