OUR 9TH YEAR OF PROVIDING PROPRIETARY CAPITAL MARKETS INTELLIGENCE ON THE CANNABIS / HEMP / PSYCHEDELIC SECTORS
Each week, Viridian publishes insights and analysis on completed capital raise transactions in the prior week, focusing on all equity and debt deals. Our analysis includes:
- Summary
- Outlook
- Best & Worst Perfromers
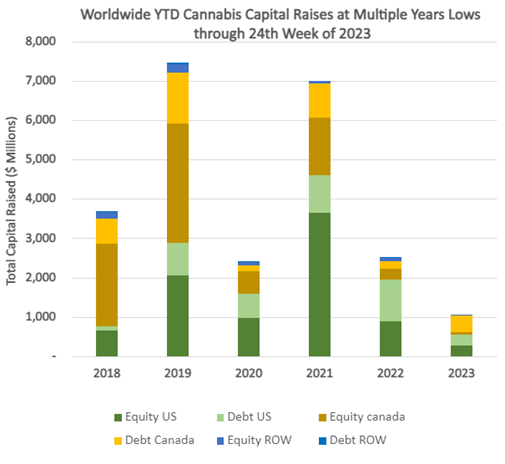
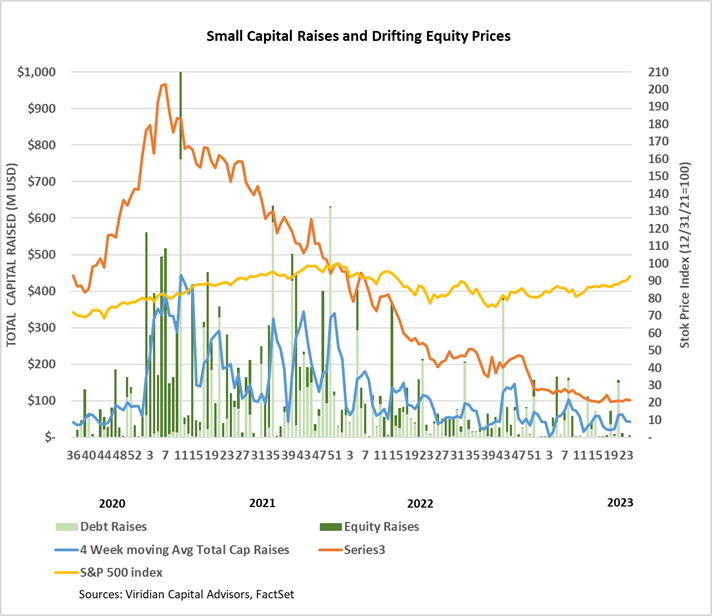
- Cannabis capital raises are off to a multi-year low. Only $1,046.15M closed through the first twenty-four weeks of the year compared to $2,503.97M last year.
- Debt represents 65.1% of total capital raised, significantly higher than in any other comparable period since 2018.
- Public companies have raised 67.2% of total capital YTD, down from 72.9% last year.
VIRIDIAN INSIGHTS
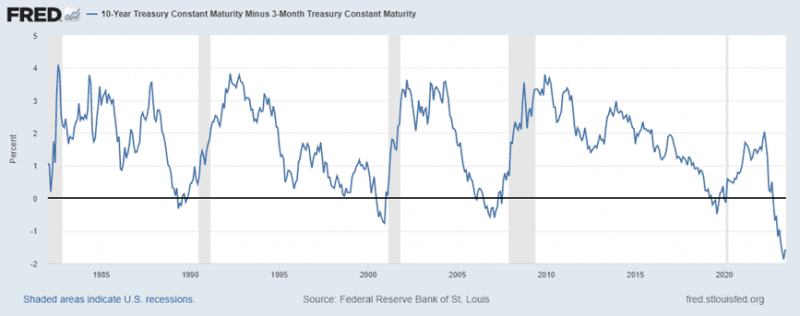
- The three-month-10-year spread has become slightly less inverted over the last two weeks. However, at -157 basis points, it is still more inverted than any period over the previous 30 years, pointing solidly toward recession. Despite Powell’s hawkish rhetoric, the market believes the Fed will avoid further rate increases. The market is misreading Powell’s true intentions; reducing goods and services inflation is only one of his goals and perhaps not the most important one. Powell aims to deflate the all-asset bubble that a decade of zero interest rates established, and it seems pretty clear that it will take a recession to do that. The alternative is to back off prematurely and live with stagflation, which may be even more damaging in the long term.
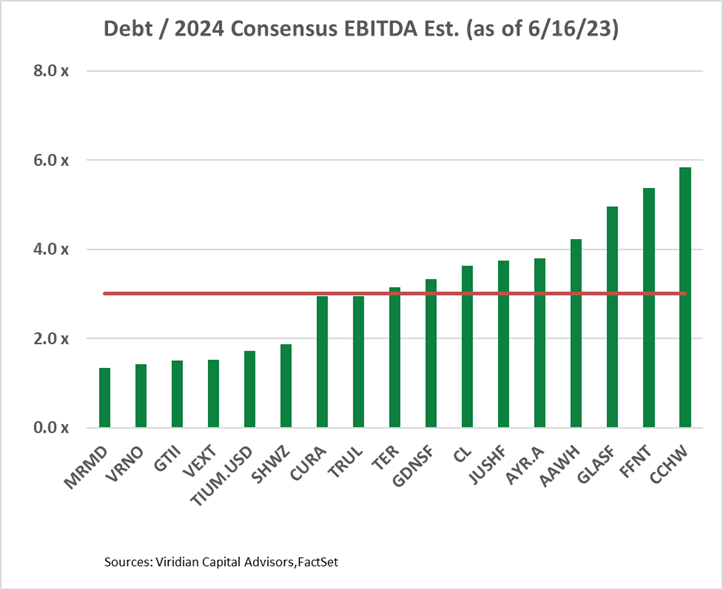
- Debt is now unsustainably high for many of the largest MSOs. Ten of the nineteen U.S. MSOs with market caps over $5M and sell-side analyst coverage now have Debt/ 2024 Consensus EBITDA estimates of over 3x. We have calculated 3x to be the approximate sustainable level of debt in the 280e environment using some simple math: If average interest rates equal 10% and effective tax rates on EBITDA equal 40%, then $1 of EBITDA for a company levered 3x debt/EBITDA will result in $.3 of free cash flow. The $3 of debt we assumed divided by the $.3 of FCF would give a payback period of 10 years!
- The companies on the graph significantly over the red line may have to contemplate a painful re-equitization to ensure their long-term survival.

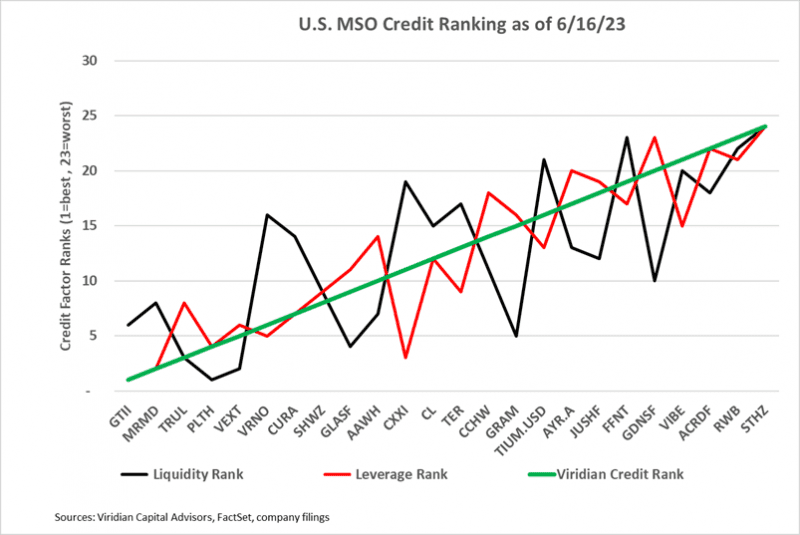
- The graphs below show our rankings of U.S. public MSOs arranged from left to right in descending order of credit quality.
- Ascend Wellness (AAWH: OTC) announced a private equity placement for $7M. Ascend plans to sell 9.86M shares at $.71 per share to a large existing debt and equity investor. Proceeds will fund opportunistic acquisitions.
- Ascend is trading at only 3.89x 2023 EBITDA relative to a median of 5.88x for the 17 companies in the Debt / 2024 EBITDA graph above, making the decision to issue equity difficult. We think it’s a good call on management’s part, however.
- In the coming months, we believe there will be opportunities to reduce Debt/ EBITDA through accretive acquisitions of distressed assets.
- We also believe Ascend could be an attractive takeover candidate, and accretive acquisitions will only make it more appealing.
- Finally, increased size and lower leverage will likely improve Ascend’s valuation metrics.
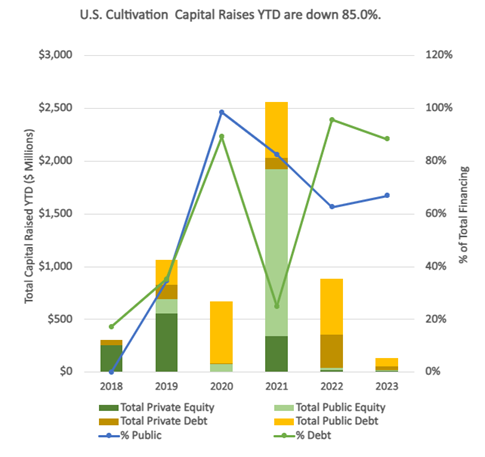
- YTD, U.S. Cultivation & Retail sector capital raises are down 85.0% from 2022.
- Debt is still the only game in town, accounting for 88.3% of all cultivation sector capital raised. 29.9% of the debt raised YTD has been for private companies.
- Large transactions are still absent from the market. There have been no debt or equity deals over $100M YTD.
- Cannabis equities (as measured by the MSOS ETF) were down 1.26% for the week.
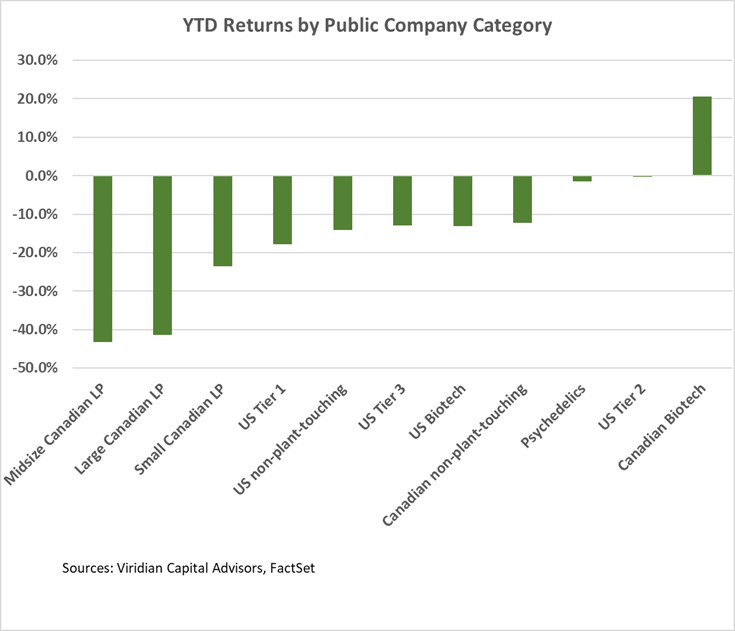
YTD Returns by Public Company Category
- The relative positioning of categories remained virtually unchanged from last week. U.S. Tier 2 sank to breakeven performance YTD. The lower gains are due to the double-digit reversals of last week’s gains by Glass House (GLASF: OTC) and Schwazze (SHWZ: OTC).
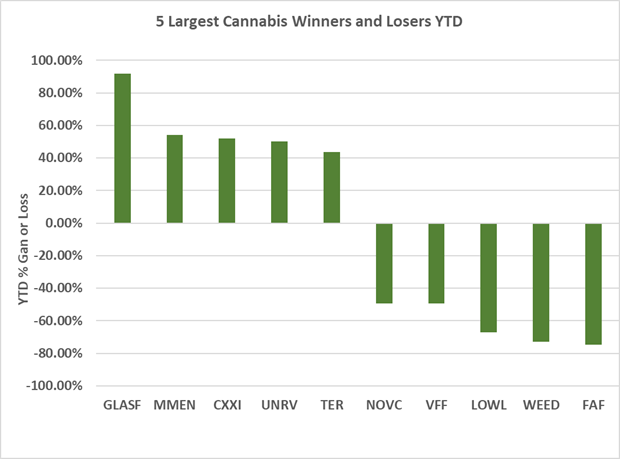
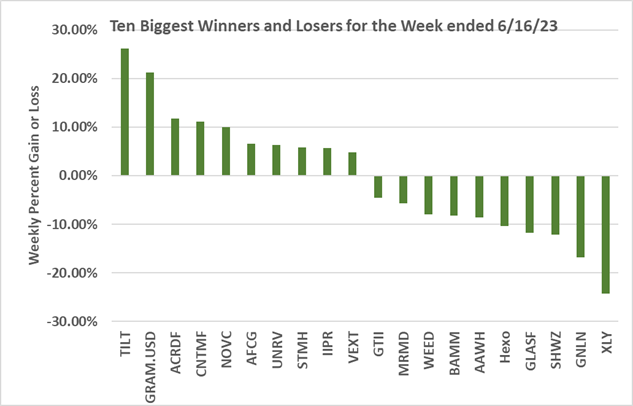
Best and Worst Performers of the last week and YTD
- Auxley (XLY: CSE) was the biggest loser, down 22.97% after last week’s largest gainer, up 34.6%. We saw no news to account for the gain; it indicates the volatility you get when trading as a $.01 out-of-the-money option.
- Ascend (AAWH: OTC) premiered on the loser list after announcing its intent to complete a $7M private placement with a large existing debt and equity investor.