OUR 9TH YEAR OF PROVIDING PROPRIETARY CAPITAL MARKETS INTELLIGENCE ON THE CANNABIS / HEMP / PSYCHEDELIC SECTORS
Each week, Viridian publishes insights and analysis on completed capital raise transactions in the prior week, focusing on all equity and debt deals. Our analysis includes:
- Summary
- Outlook
- Best & Worst Perfromers
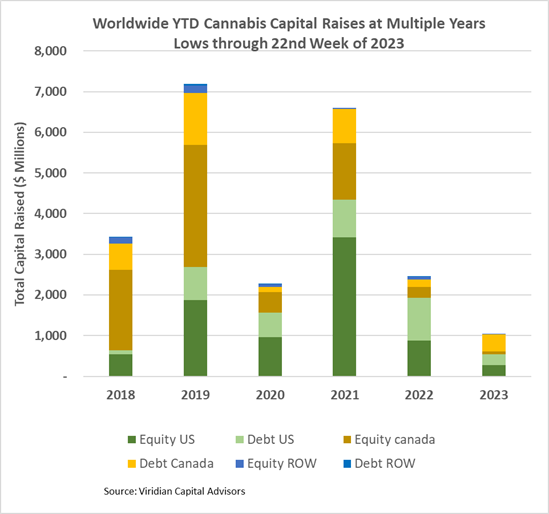
- Cannabis capital raises are off to a multi-year low. Only $1,039.64M closed through the first twenty-two weeks of the year compared to $2,460.36M last year.
- Debt represents 65.4% of total capital raised, significantly higher than in any other comparable period since 2018.
- Public companies have raised 67.3% of total capital YTD, down from 73.1% last year.
VIRIDIAN INSIGHTS
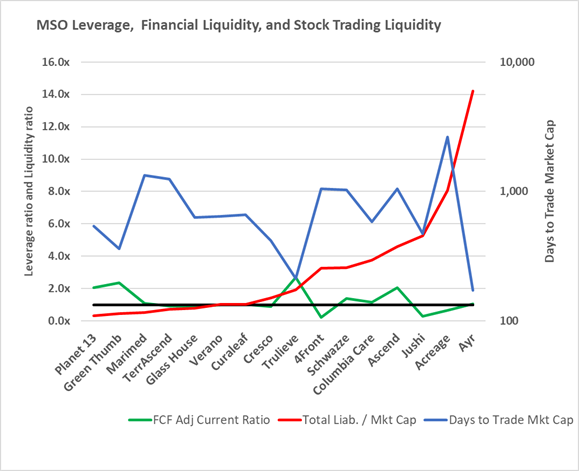
- Financial illiquidity, stock illiquidity, high leverage, and the continued near-shutdown of cannabis capital markets are interacting for exciting times ahead.
- The two graphs below portray several features of the landscape that concern us.
- The first graph has three lines representing financial liquidity, stock liquidity, and market leverage.
- The green line represents the free cash flow adjusted current ratio, our favorite liquidity indicator. Numbers below one indicate a likely need for additional financing during the year, while negative numbers indicate severe liquidity stress. The red line is the Total Liabilities to market cap. We have found that numbers above 3x signal the need for greater scrutiny and caution. Finally, the blue line (measured on the right axis) shows the days to trade the company’s entire market cap based on the stock’s average dollar volume. The lower the blue line, the more relatively liquid the stock is.
- Based on the above considerations, Jushi, Acreage, and AYR are all flashing danger. AYR has some good market bets in New Jersey and Florida if it can get past the 2024 maturity issue. The company has relatively good trading liquidity in its stock, with the lowest number of days to trade its market cap. The overall picture suggests that a steep fee and a generous helping of warrants might entice noteholders to extend maturities. Jushi may have a more complex problem. Its major bets in Virginia and Pennsylvania do not look very fruitful in 2023 or even 2024, so it’s unclear where the turnaround will come from. Acreage, with low liquidity and high leverage, used to get implied credit support from its Canopy linkage, but that may no longer be a positive.
-
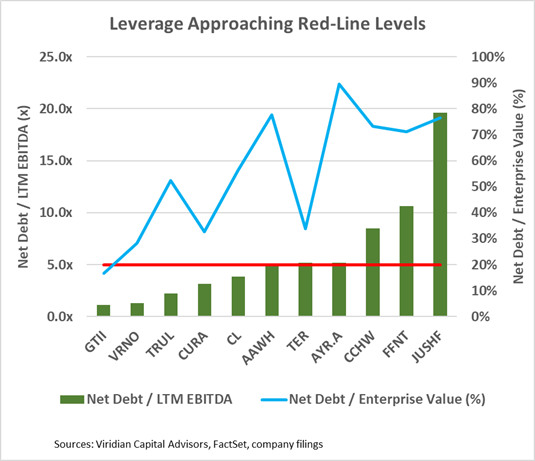
- The second graph presents two other ways to look at leverage: Net Debt/ LTM EBITDA and Net Debt/ Enterprise Value.
- IRS rule 280e puts a cap on the amount of sustainable debt for plant-touching companies. Assuming a company has a gross margin of 50% and an EBITDA margin of 27% (equal to consensus 2023 expectations for tier 1s), we can generate a tax rate of over 50% on EBITDA. But even assuming a generously low 40% and debt rates of 10%, we find that a 3x Net Debt/ EBITDA implies a nearly 10-year debt payback period. We are neglecting revenue growth but also ignoring capex and working capital, so let’s call that a wash. Conclusion? 3x is too high to be sustainable.
- The graph below shows that five of the eleven companies 5x line have over 5x Net Debt/ EBITDA, well over the sustainable line. The blue line indicates net debt/enterprise value. Higher blue lines indicate a lower percentage of cushion between the market value of the assets and the debt
- Jushi is the obvious stand-out on this graph as well.
- More signs of debt trouble appear in the market.
- Today Fire & Flower (FAF: CSE), a company that investors felt more comfortable with as recently as April, filed for Bankruptcy. The DIP lender (probably soon to be stalking horse bidder) is Alimentation Couche-Tard, the relationship that looked to be the company’s savior.
- This week Irwin Naturals announced it was in default of covenants on its senior debt agreement. So far, the lender is forbearing, but it just shows how quickly things can turn. Irwin Naturals had been an aggressive acquirer, but perhaps it flew too close to the sun.
- Today StateHouse (STHZ: CSE) announced the sixth amendment/extension on its senior secured line to June 19. The company has been near the bottom of our credit rankings for quite some time, with one of the worst liquidity profiles of any company we survey. After the quarter’s close, the company received $6.4M for ERC funds, but that will hardly put a dent in its negative $107M of working capital. We are watching this one closely as its operational turnaround doesn’t seem enough to clear its hurdles.
- These examples are the tip of the iceberg for what we see ahead. Lack of liquidity, overleveraged balance sheets, and closed capital markets equal a circling of vultures, or “opportunity funds?”
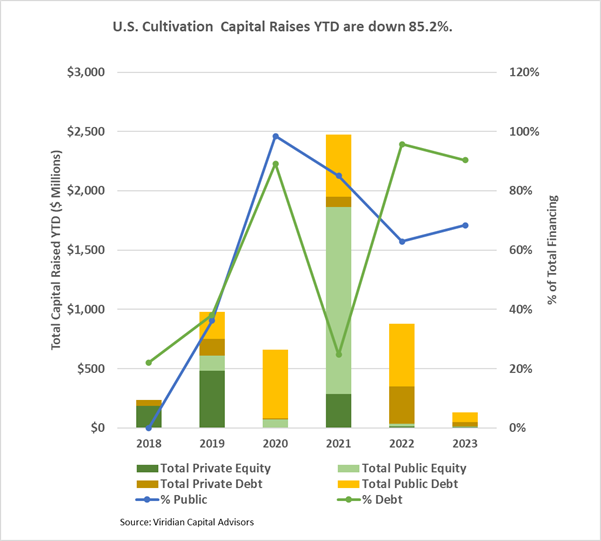
- YTD, U.S. Cultivation & Retail sector capital raises are down 85.2% from 2022.
- Debt is still the only game in town, accounting for 90.4% of all cultivation sector capital raised. All the debt raised YTD has been for public companies.
- Large transactions are still absent from the market. There have been no debt or equity deals over $100M YTD.
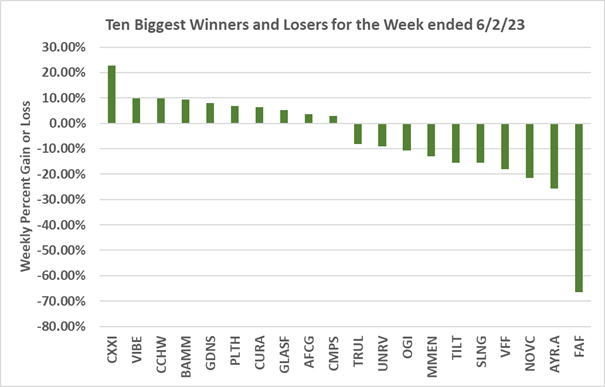
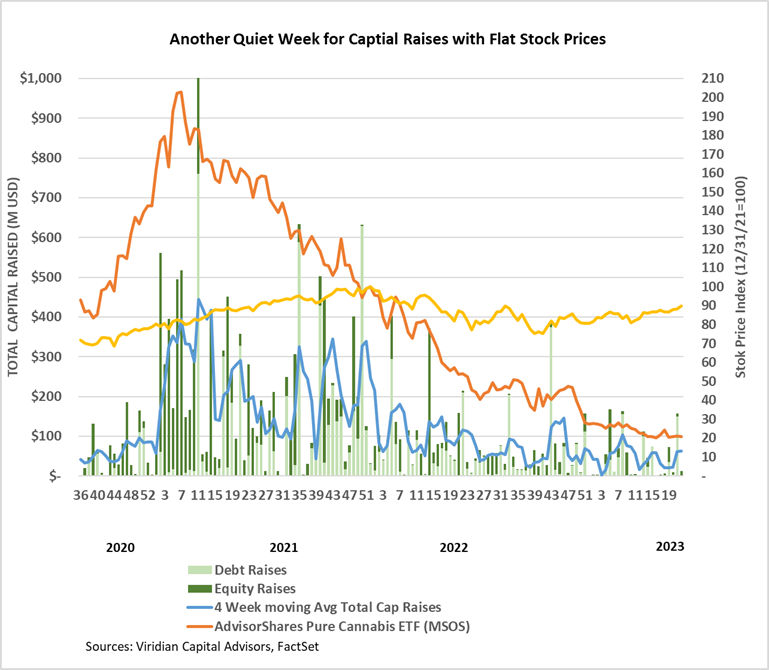
- Cannabis equities (as measured by the MSOS ETF) were down .19% for the week.
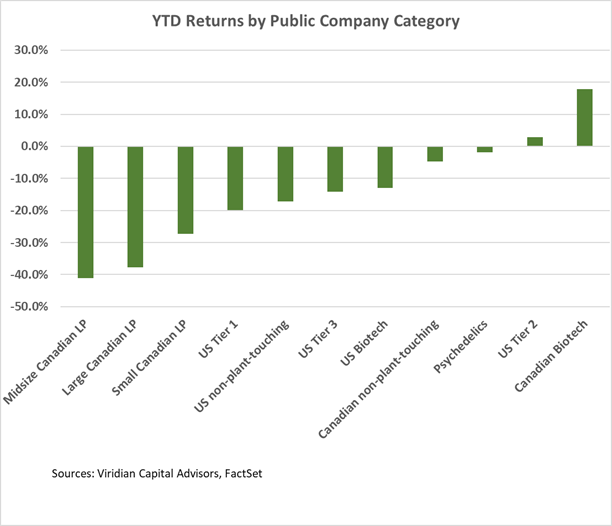
YTD Returns by Public Company Category
- The relative positioning of categories remained virtually unchanged from last week. U.S. Tier 2 became slightly more positive at a 2.9% gain YTD. The move was driven by a 7.8% weekly gain by 4Front (FFNT: OTC) and a 5.2% gain for Glass House (GLASF: OTC).
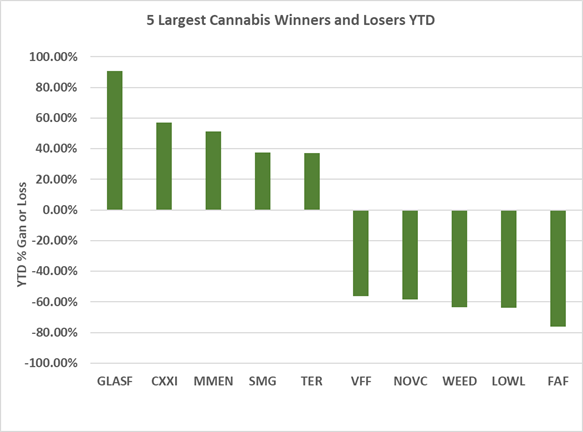
Best and Worst Performers of the last week and YTD
- C21 Investments (CXXI: CSE) was the week’s biggest gainer, up 22.7% despite declining revenues and EBITDA. The company announced that it had fully paid off the final $2M of a $30M note to its CEO, Sonny Neuman, which it incurred in the purchase of Silver State in 2019. The collateral backing the loan is now available to support other borrowings, and the annual principal payment of $6M is eliminated. C21 also announced record wholesale revenues from its Nevada operations in the first fiscal quarter.
- Fire & Flower (FAF: CSE) was the week’s biggest loser, down 76.1% on the news that it had hired a financial advisor to explore financial alternatives. The move was widely regarded as preparation for the bankruptcy filing, which the company entered on June 6, 2023. An affiliate of Alimentation Couche-Tard (“Act”) provided a C$9.8M DIP loan. In April, FAF entered into a Master Licensing Agreement with a subsidiary of ACT, under which Couche Tard committed to developing Fire & Flower branded retail stores.