OUR 9TH YEAR OF PROVIDING PROPRIETARY CAPITAL MARKETS INTELLIGENCE ON THE CANNABIS / HEMP / PSYCHEDELIC SECTORS
Each week, Viridian publishes insights and analysis on completed capital raise transactions in the prior week, focusing on all equity and debt deals. Our analysis includes:
- Summary
- Outlook
- Best & Worst Perfromers
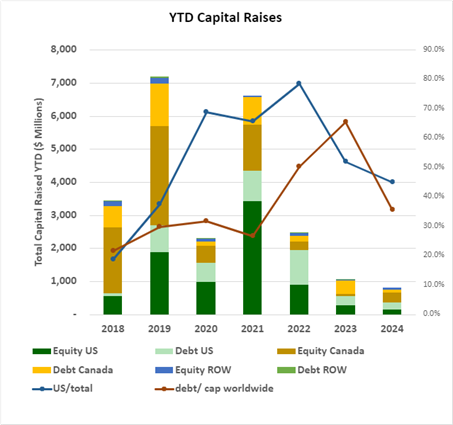
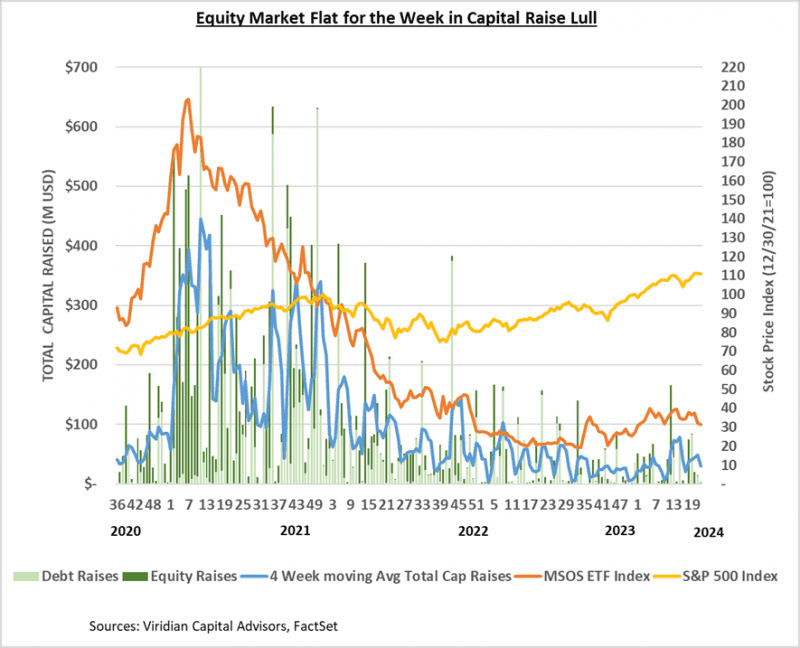
- YTD capital raises totaled $810.98M, down 22% from the same period in 2023. Debt as a percentage of capital raised dropped to 35.5% from 65.4% in the previous year on a worldwide basis. The U.S. bucked this trend with 58.1% of capital raised in debt compared to 48.9% in 2023
- U.S. raises accounted for 45.0% of total funds, the lowest percentage since 2019. Conversely, raises from outside the U.S. represented a historically high 9.7% of the total funds raised.
- YTD raises by public companies accounted for 64.1% of total funds.
VIRIDIAN INSIGHTS
- IS ACREAGE A SAVING GRACE OR ANOTHER ALBATROSS FOR CANOPY?
- We distinctly remember the shock and awe associated with the announcement on April 18, 2019, that Canopy Growth had entered into an agreement granting it the right to acquire Acreage with a “requirement to do so at such time as cannabis production and sale becomes federally legal in the United States.”
- Both companies were riding high (pun intended), and the excitement was palpable. Little could anyone guess the levels of misfortune that would befall both of them in the ensuing years. And the idea that federal legalization would appear to be just as far away now as it was five years ago would have been considered ludicrous. But here we are…
- Acreage filed a late 10Q on 5/31/24, and the results were generally disastrous.
- Q1 Revenues were down 19% from the previous year, and Adjusted EBITDA dropped from $10.6M to $2.0M.
- Cash fell to $7.3M
- The company is in default on its $133M Prime rate credit facilities and has received two default notices from the facility’s agent. The first default notice on April 20 alleged three events of default. The company is also in default on a monthly interest payment due May 1. Based on the facility’s rate of 11.25% (5.75pts over a 5.5% prime floor), we estimate the monthly interest payment would approximate $1.25M.
- Interestingly, Kevin Murphy’s (former CEO of Acreage) finance company, Viridescent, lent $40M of the $140M outstanding. AFC Gamma was the other named lender. Is there a loan-to-own strategy at play here? We highly doubt it, but stranger things have happened in cannabis.
- Acreage financial statements contain a “going concern” qualification.
- The company classified $46.7M of its Ohio assets as a current asset held for sale. Still, subsequent to the quarter’s end, it was determined that the assets did not meet the held-for-sale criteria as the company intends to retain and operate the Ohio assets. This reclassification is likely to result in a more significant working capital deficit. But fundamentally, it appears to be a realization that selling your most promising assets is not generally a way out of a downward spiral.
- Acreage’s ranking in the Viridian Credit Tracker has been deteriorating for several months. It was ranked 22/30 in February, dropped to 24/30 in April, and is now ranked 28/30. The only two companies ranked worse are StateHouse and Red White & Bloom, which is not a group you want to be included in.
- The bottom line is that it may have taken Canopy too long to get Acreage under its wing. The numbers are now pretty ugly, and it is unclear if lenders will play the extend, amend, and pretend game or what they might extract in return.
- Still, Acreage is central to Canopy’s hopes for the U.S. market and the growth story that Canopy is desperate to tell. Canopy certainly has ample incentive to try to bail Acreage out, but it is unclear if they have the remaining financial strength or management depth to get the job done.
- A STRONGLY CREDIT ACCRETIVE MERGER
-
- The announced merger with RIV Capital enhances Cansortium’s credit profile, and the Viridian Credit Tracker model ranking improves from #18 to #8,
- Cansortium’s net cash position goes from -$60.7M to $5.1M, dramatically improving its Viridian Capital Liquidity ranking from #23/30 to #9/30.
- Leverage is also significantly reduced, predominantly from the conversion of $175M of Hawthorne debt into Cansortium equity. The conversion also demonstrates support from Hawthorne’s parent, Scotts Miracle Grow.
- The combined company will jump to a #10 size ranking compared to the #21 ranking Cansortium had prior to the announcement.
- The transaction significantly improves the combined company’s ability to attack potential rec conversions in Pennsylvania and Florida.
- The deal risk arb spread now stands at 22.7% (see our table below in M&A). We think this is a pretty fair spread, given the time to completion and the number of moving pieces involved.
-
- LESS RECOGNIZED BENEFITS OF RESCHEDULING: HIGHER SUSTAINABLE DEBT LOADS AND INTERNALLY FUNDABLE GROWTH
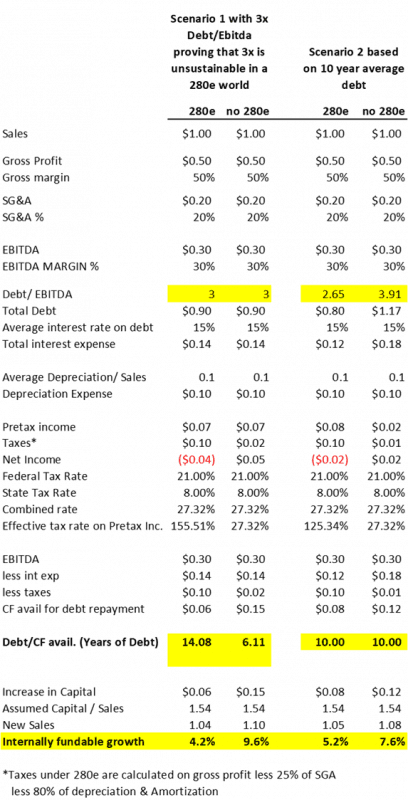
- Key takeaways from the chart below
- The analysis assumes a hypothetical company with $1 of sales, 50% gross margins, and 30% EBITDA margins.
- The analysis shows that the hypothetical company experiences greater than 100% effective tax rates despite the allocation of 80% of depreciation expense and 25% of SG&A expense to COGS. The same company would have a combined state and federal effective tax rate of 27.32% without 280e
- Debt levels of 3x EBITDA are not sustainable in a 280e world, but not because interest coverage is inadequate. Using 15% average debt, we get 2.14x EBITDA/Interest coverage. The issue is the debt payback period. We calculate a debt payback of over 14 years with the given assumptions, which no regular cannabis lenders (except sales leaseback providers) will accept. S3 reduces the payback period to a more acceptable 6.11 years.
- If we assume ten-year payback periods, the removal of 280e would increase sustainable debt loads from 2.65x Debt/EBITDA to 3.91x.
- The bottom set of numbers shows the impact 280e has on internally fundable growth. In this analysis, we utilize the capital/sales ratio of 1.54x, which we discussed in the Virdian Chart of the Week. With 280e and 3x debt, companies can only internally fund 4.2% sales growth. The elimination of 280e more than doubles internally fundable growth to 9.6%.
- Key takeaways from the chart below
- The DOJ has signed off on S3, and the 60-day public comment period has commenced. Why does the equity market not care?
- Investors are tired and have been spoofed too many times. When someone says, “It could take up to a year…” Cannabis investors immediately immediately think, “It’s never going to happen.” It now seems to us that it is overwhelmingly likely to happen, and the critical question is whether it will really happen as quickly as advertised.
- Institutional investors who have avoided the space would rather miss part of the rally than jump in for another ride like the last two years. Talking to investors, rating agencies, and other constituents, we find deep distrust for administrative actions like rescheduling. It is ironic that the very lack of congressional involvement that makes S3 likely to happen also imbues it with an aura of impermanence. Like the Cole memo, the fear is that a new administration may delay implementation or even reverse course.
- Many details still need to be worked out, and investors still question how the State programs, the FDA, and Big Pharma will interact in an S3 world. Widely differing opinions exist on when S3 will actually become effective.
- S3 could potentially have some perverse results. The extra funds might be competed away in misplaced attempts to gain market share. Also, the additional cash could foster capacity additions that hasten oversupply and commodity price declines.
- We generally give little credence to claims that the DEA and FDA will become more rigorous in enforcing federal laws requiring S3 products to be approved by the FDA. Our position is based on two words: politics and money. Rescheduling is only coming to fruition because Biden is desperate for youth votes, and his DOJ is unlikely to support a new crackdown on state-licensed cannabis programs that it didn’t do while cannabis was S1. It is likely to undertake actions detrimental to tax-paying state-based businesses.
- Still, despite the uncertain timing, regulatory implementation, etc., our view is that the various regulatory, judicial, and legislative tracks for cannabis industry reforms are mutually reinforcing. We have never seen so many potential upside catalysts in any other industry. We still view a doubling in price levels as reasonably achievable.
-
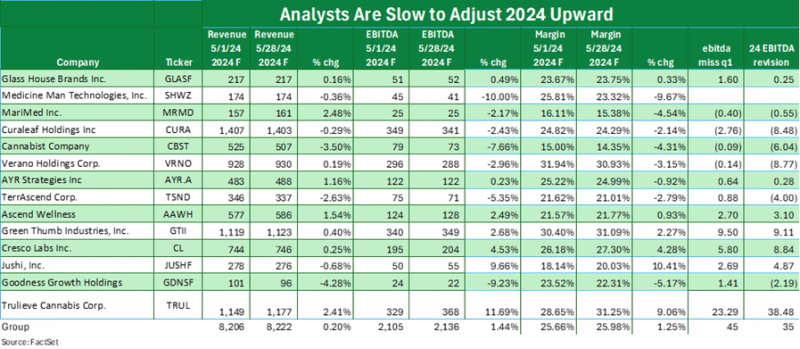
- ANALYSTS ARE CATCHING UP TO Q1 REALITY, BUT THEY AREN’T THERE YET!
- Our claim since the beginning of 2024 has been that, after being burned by having to continually mark down their estimates for 2023, analysts are now too conservative on the upswing in 2024.
- The chart below shows analysts’ 2024 estimates from 5/1/24 compared to their estimates on 5/28/24. Revenue estimates have been adjusted upward by .2%, while EBITDA estimates are up 1.44%.
- The companies on the chart beat EBITDA estimates by $45M, but overall EBITDA estimates have only been revised upwards by $35M. Has something become less favorable for the remainder of 2024 than it was at the beginning of the month?
- Full-year EBITDA margin estimates are now at 25.98%, remarkably still lower than the actual results of 26.06% for Q1, a seasonally weak quarter whose margins have been lower than the full-year margins for the last two years.
- We continue to expect more upward revisions.
- ANALYSTS ARE CATCHING UP TO Q1 REALITY, BUT THEY AREN’T THERE YET!
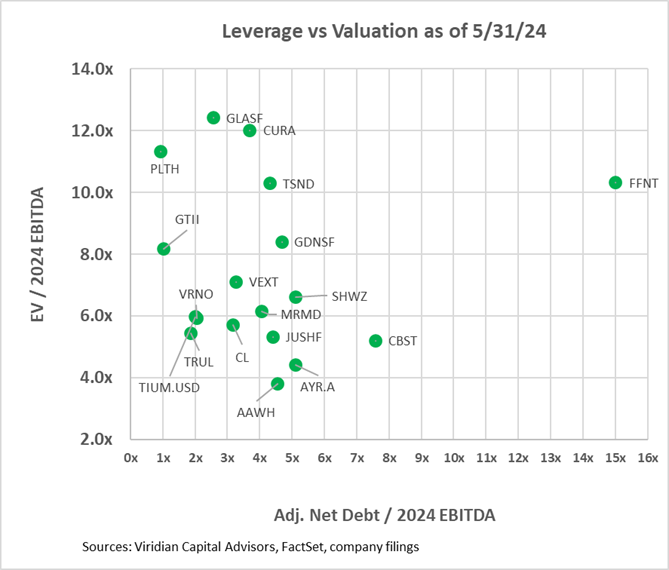
- VALUATION, LEVERAGE, AND LIQUIDITY
- The two graphs below show the Enterprise value to 2024 EBITDA multiples against two leverage measures. In the first graph, we have calculated an Adjusted Net Debt/ 2024 EBITDA figure by adding any accrued taxes over 90 days of tax expense to debt before subtracting cash to arrive at Adjusted Net Debt. We would expect any regular company to have accrued taxes equal to their last quarterly tax expense and consider that a standard working capital item. Several companies on the chart have far greater than 90 days of accrued taxes, and we consider the excess to be debt. Verano’s excess tax liabilities equal nearly 40% of its debt. Other companies with relatively high imputed tax debt include Curaleaf (CURA: CSE), 4Front (FFNT: CSE), and Terrascend (TSND: TSX). We have adjusted our accrued tax liabilities for comparability by adding back the tax liabilities that Trulieve, TerrAscend, and AYR moved into long-term liability accounts.
- The first graph shows that twelve of the eighteen companies have net debt/ 2024 EBITDA over 3x, which we view as the cutoff of sustainability in a 280e world. We view 4x as sustainable in a post-280e environment, and nine companies are now over that threshold. This week, we included Cansortium, proforma for the merger with RIV. We analyze the credit quality of the combination further below in our credit modeling results but suffice it to say the graphs presented here make the case for significant uprating.
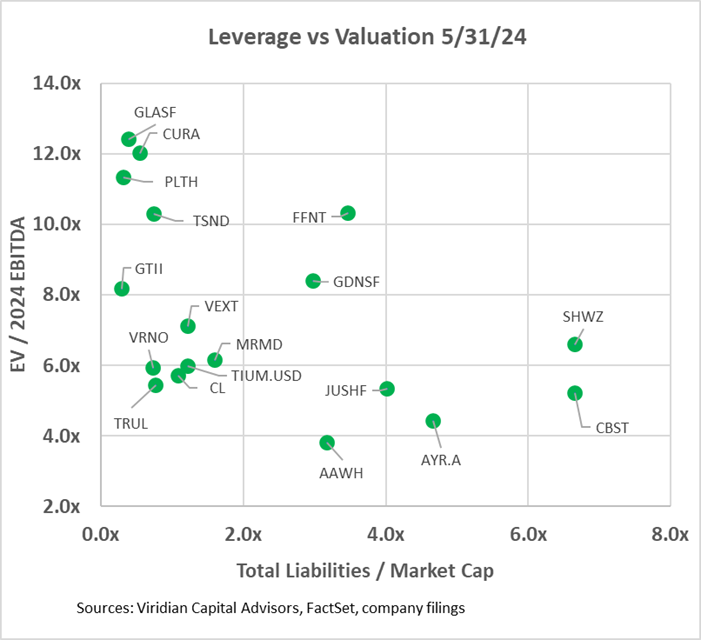
- The second graph looks at leverage through the lens of total liabilities to market cap. This measure separates the companies into four groups:
- On the bottom left are companies with low valuation multiples but also low market leverage. The group includes Verano, Trulieve, Cresco, and MariMed. The other three show that the market is not yet willing to fully sign on to the Florida rec story.
- In the middle, between 2x and 4x total liabilities/market cap, we see 4Front, Ascend, AYR, Goodness Growth, and Jushi. Each of these has more than 4x debt/ EBITDA, which is borderline in terms of sustainability, even in a non-280e world. However, each also has significant upside catalysts that could mitigate or exacerbate the excess leverage. FFNT is ramping up production at its mammoth Illinois cultivation facility. Ascend has a $275M term loan maturing in August 2025 that will need to be extended or refinanced. This loan is 110% of the company’s market cap, which is higher than the percentage of debt maturities that AYR restructured at the end of 2023. Jushi is levered to potential adult rec developments in Pennsylvania and Virginia.
- On the right lie Cannabist and Shwazze. The high level of market leverage tells us that the market questions whether they can discharge their liabilities without significantly dilutive actions, doubts also shown by their 21/30 and 20/30 positioning in our weekly credit ranking.
- At the top left are companies with high valuation metrics and low leverage. These companies should look to do an equity issuance depending on their positioning in the liquidity graph below.
- The third graph introduces the free cash flow adjusted current ratio liquidity measure into the mix. Companies with less than 1x on this measure will likely have to raise capital next year. Surprisingly, eight of the companies fall into this bucket. This graph also breaks the sector into three distinct groupings. The bottom left group has low leverage but also modest liquidity. Some of the companies, including Verano, MariMed, and Cresco, have sufficient but not comfortable levels of liquidity, while others, including Curaleaf, TerrAscend, and Glass House, are below the critical 1x liquidity line. Companies on the lower right generally have constrained liquidity and high leverage, a potentially dangerous combination in a capital-constrained environment. Shwazze bears particular attention. The company has just changed auditors and has announced that it will be late in filing its q1 reports. Moreover, the company has $29M of debt maturing in February 2025, and progress toward refinancing this debt should be watched closely.
- Looking at leverage in two ways and having a comprehensive measure of liquidity can give investors a good idea of possible scenarios for today’s overleveraged companies.

-
-
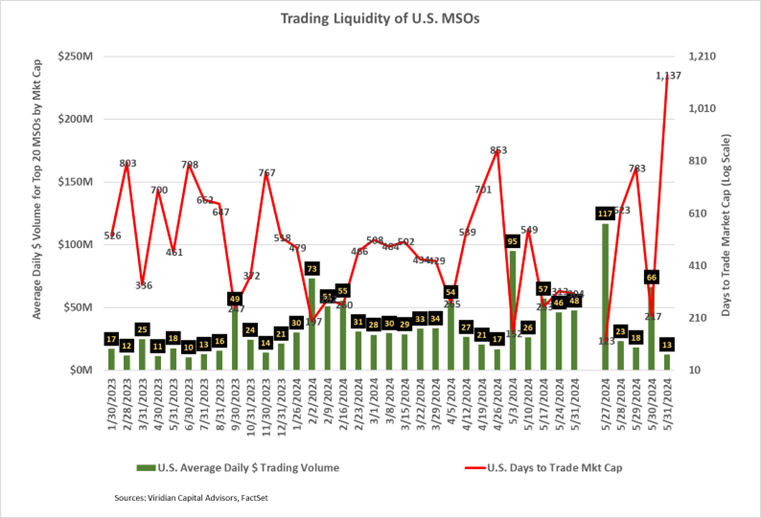
- CANNABIS STOCK LIQUIDITY REMAINED RELATIVELY CONSTANT, BUT A QUIET PERIOD LOOMS
- The average daily dollar volume of $46M remained well above YTD weekly averages.
- The Days to Trade Market Cap (DTTMC) series depicts the number of days it would take to trade the market cap of a stock or group of stocks. The weekly reading on 5/31/24 of 304 days was the seventh-best in 2024. A 304 DTTMC implies that an investor who acquired a 5% position in the stock, assuming he wanted to be less than 25% of the average daily dollar volume, would require 61 days to trade out of his position.
- But summer doldrums are approaching, and no significant catalysts are expected in the next month or so to drive volume.
- CANNABIS STOCK LIQUIDITY REMAINED RELATIVELY CONSTANT, BUT A QUIET PERIOD LOOMS
-
-
-
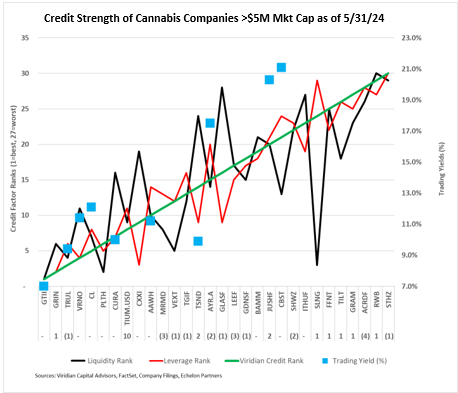
- GIVING CREDIT WHERE CREDIT IS DUE
- The chart below shows our updated 5/31/24 credit rankings for the 30 U.S. cannabis companies with over $5M market cap. The number below the ticker symbol indicates the change in credit ranking since last week, where a negative number suggests credit deterioration, while a positive indicates improvement.
- The blue squares show the offered-side trading yields for each company. Trading yields have declined significantly since the HHS rescheduling announcement.
- Consortium, proforma for its merger with RIV, was the biggest credit quality gainer of the week, jumping to #8 from #18 last week. The company gains significantly in liquidity and leverage from the combination and the conversion of Hawthorne debt to equity.
- Acreage sank to #28/30 based on horrible quarterly results that had nearly everything wrong. There is a significant sales decline, negative cash flow from operations, dwindling cash balances, and payment default on senior secured debt. Need we say more? The company now ranks just above StateHouse and Red White & Bloom.
- GIVING CREDIT WHERE CREDIT IS DUE
-
- Cannabis equities (as measured by the MSOS ETF) ended down 1.84% for the week.
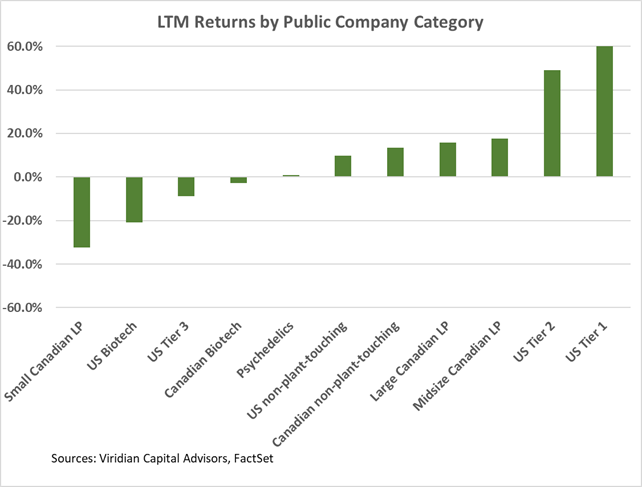
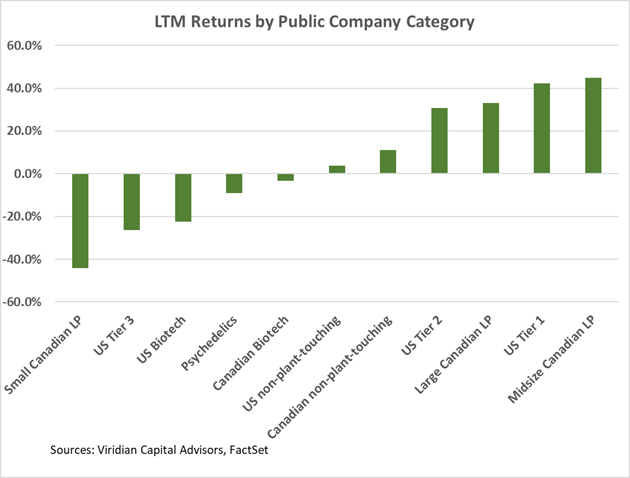
Trailing 52-Week Returns by Public Company Category:
- U.S. Tier One MSOs are now only up approximately 44% for the LTM period and have been beaten out for first place by Midsized Canadian LPs.
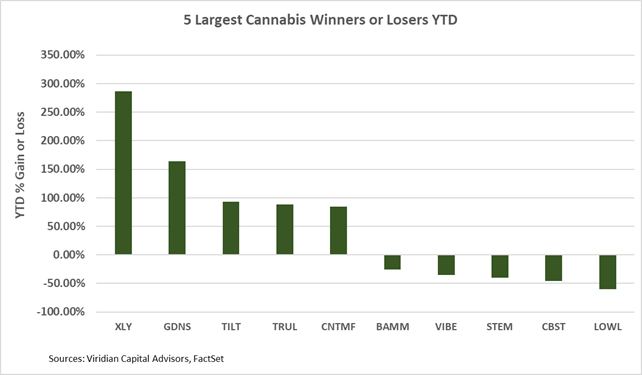
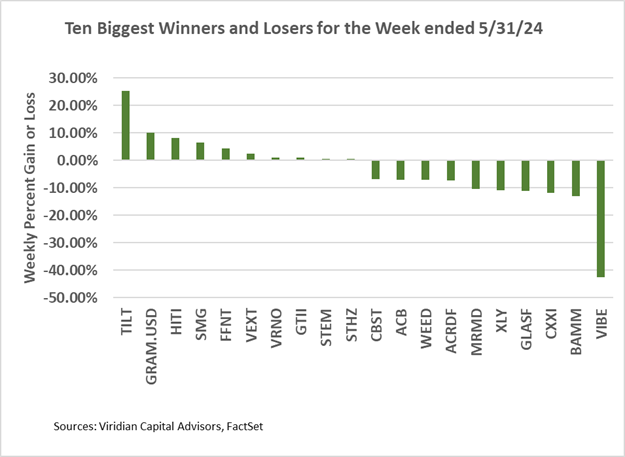
Best and Worst Performers of the last week and YTD:
- Tilt Holdings was the week’s biggest gainer, although we saw no specific news to account for the increase. Tilt should benefit from the start of adult use in Ohio, and its recent financing deal, although expensive, assures that it will have funding to build out stores in Pennsylvania.
- Vibe was the biggest loser. The company filed its quarterly statements for the period ended March 31, 2024, showing continued working capital deficits, qualified financial statements, and year-over-year revenue declines.