OUR 9TH YEAR OF PROVIDING PROPRIETARY CAPITAL MARKETS INTELLIGENCE ON THE CANNABIS / HEMP / PSYCHEDELIC SECTORS
Each week, Viridian publishes insights and analysis on completed capital raise transactions in the prior week, focusing on all equity and debt deals. Our analysis includes:
- Summary
- Outlook
- Best & Worst Perfromers
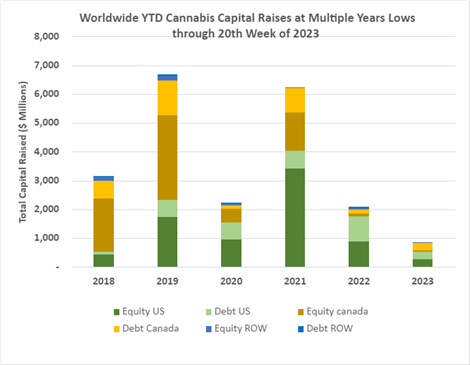
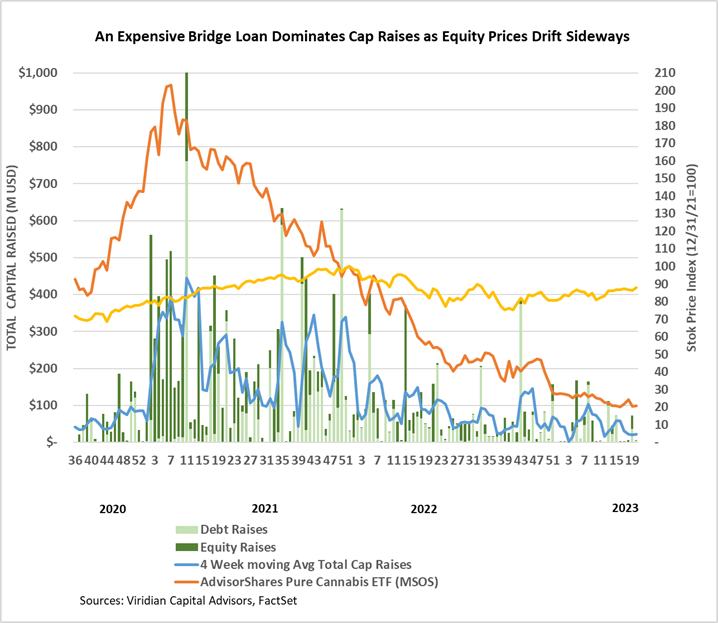
- Cannabis capital raises are off to a multi-year low. Only $870.31M closed through the first twenty weeks of the year compared to $2,064.11M last year.
- Debt represents 60.9% of total capital raised, higher than in any other comparable period since 2018.
- Public companies have raised only 61.0% of total capital YTD, down from 76.4% last year.
VIRIDIAN INSIGHTS
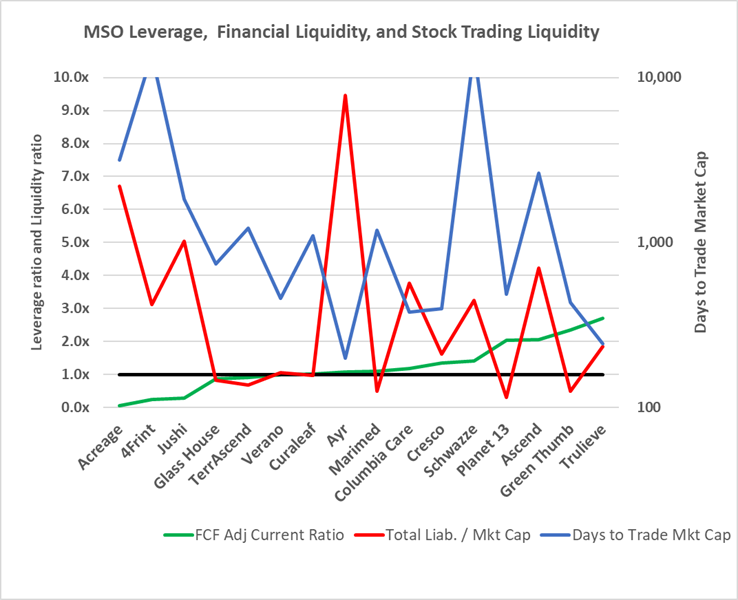
- Liquidity is the topic of the day, and rightfully so. Financial liquidity is highly prized in a market where capital is scarce and expensive. Our favorite measure of liquidity is the free cash flow adjusted current ratio, which modifies the standard current ratio by adding annualized free cash flow to the numerator, thereby considering the company’s cash burn rate. Companies with measures above one theoretically have sufficient liquid assets (along with their free cash flow) to pay off all short-term liabilities (including current debt maturities). In contrast, companies with numbers under one will likely require additional financing during the year.
- Another meaning of liquidity relates to the trading liquidity of the stock, typically measured in terms of average shares traded per day. We have created a new indicator, days to trade the market cap, defined as the market cap divided by the average daily dollar volume.
- Still, another possible way to look at liquidity is the availability of incremental debt, which depends on existing leverage. Our favorite measure of leverage is total liabilities to market cap. We have found that values above 3x are cause for inspection, and numbers over 4x are cause for concern.
- The graph below puts all three indicators together in ascending order of financial liquidity. Looking at Acreage (ACRDF: OTC), for example, the green line shows the company has the lowest free cash flow adjusted current ratio of the group, probably because it continues to have negative cash flow from operations.
- Looking at the red line for leverage, we see that ACRDF has over 6x liabilities to market cap, an extremely high reading that would indicate that obtaining incremental debt could be problematic. Finally, the blue line shows that Acreage has about 3,150 days to trade market cap, a very illiquid stock. Together, these three indicators tell us that this is a company we would want to follow very closely if it were in our portfolio. The numbers do not tell the whole story, though, as Canopy is acquiring Acreage (CGC: Nasdaq), at least temporarily bolstering liquidity.
- Another example is AYR Wellness (AYR.A: CSE). AYR’s liquidity reading on the green line is 1.06, which is not great but adequate. AYR’s real liquidity issue does not show up on this measure since it relates to debt due at the end of 2024. Its market leverage is over 9x, indicating that placing more debt on the company would currently be difficult. Finally, looking at its stock liquidity on the blue line, we see that AYR trades more dollar volume for its market cap than any other company on the list, providing some comfort that some convertible or equity-linked obligation may be an option for AYR.
- Looking at the three lines in the graph lets us know whether the company will likely need financing in the next year and whether debt or equity will be a better option. Ideally, we want a high green line and low red and blue lines.
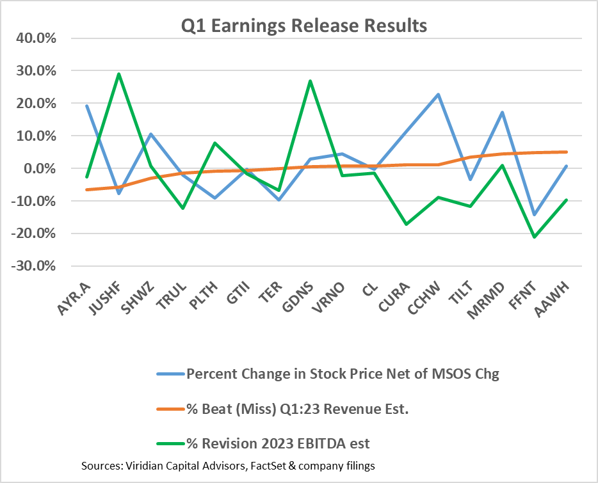
- Earnings releases for Q1:23 are nearly completed, and the graph below displays the updated results. Three companies, Jushi (JUSHF: OTC), Planet 13 (PLTH: CSE), and Goodness Growth (GDNS: CSE), had positive 2023 EBITDA revisions, while twelve had flat to down revisions. Five companies had greater than 10% downward revisions, Trulieve (TRUL: CSE), Tilt (TILT: NEO), 4Front (FFNT: CSE), Curaleaf (CURA: CSE), and Ascend Wellness (AAWH: OTC). Note the companies on the right had the most significant percentage revenue beats but also the largest negative percentage 2023 EBITDA revisions. We hope that firming prices in California and a few other established markets will allow EBITDA revisions to become neutral, essential to building a pricing floor.
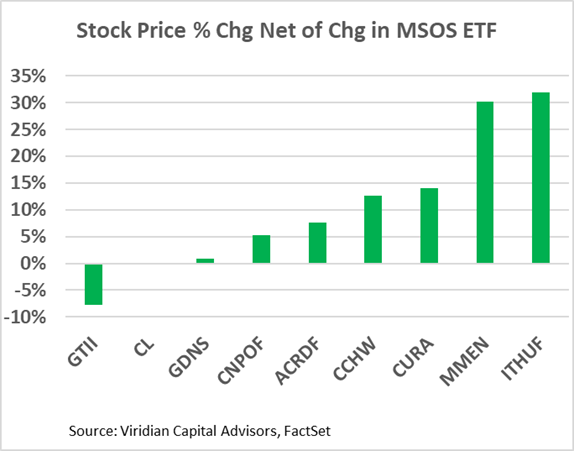
- We continue to follow the impact of recently proposed changes in New York cannabis regulation on medical cannabis license holders (Ros). The graph below shows the percentage change in stock prices between 5/5/23 and 5/22/23 after netting out the percentage change in the MSOS ETF. Most of the ROs have outperformed the MSOS since the announcement of the proposed changes, although we put little emphasis on the movements of MedMen and IAnthus. These two stocks trade primarily on volatility as out-of-the-money options.
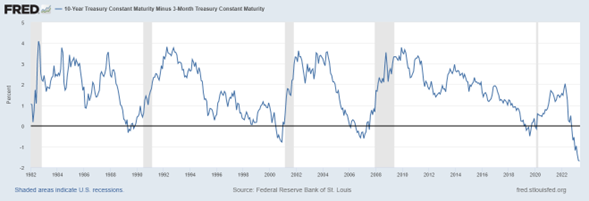
- The three-month-ten-year spread remained about unchanged at -168bps. The graph below shows that the inverted curve has correctly predicted the last five recessions, and typically, the curve becomes normal and then steepens as the recession commences. There is another way that the yield curve normalization could occur, however. Let’s consider some extra data points to illustrate: the two-year treasury yield is now at 4.29%, while the 1-year rate is 5.07%. Putting those two together, we can derive the one-year forward, one-year rate of 3.50%. Today’s yield curve tells us that one-year rates will decline over 150 bp over the next year. How will this happen? Our read is that we are likely to be in a relatively severe recession, forcing the Fed to cut rates to keep the economy from tanking. The bond market believes this is the story and has the last five recessions as proof. An alternative theory is that the economy keeps purring at a roughly unchanged pace while inflation falls dramatically and the Fed drops rates in recognition of the reduced inflation. This is the “fed pivot” argument that the equity market (away from cannabis, at least!) seems to favor. Which market do you think is right?
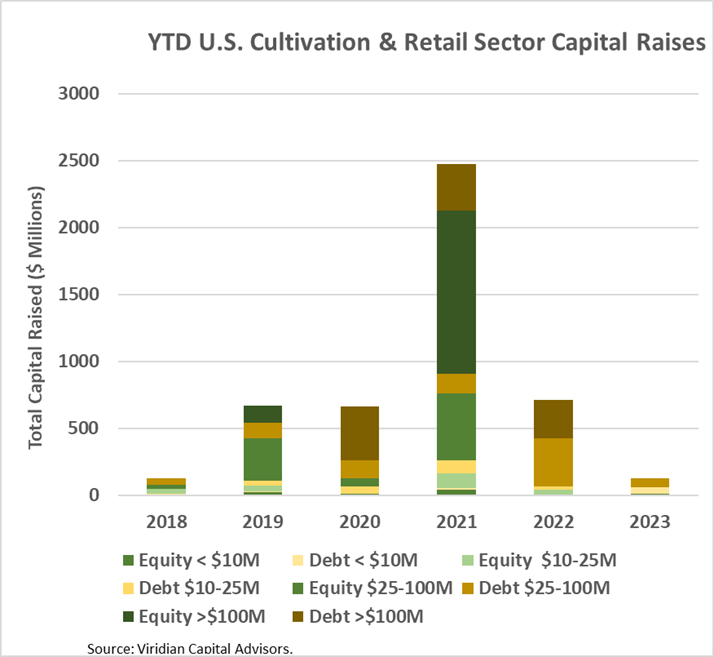
- YTD, U.S. Cultivation & Retail sector capital raises are down 82.5% from 2022.
- Debt is still the only game in town, accounting for 92.9% of all cultivation sector capital raised. All the debt raised YTD has been for public companies.
- Large transactions are still absent from the market. There have been no debt or equity deals over $100M YTD.
- Cannabis equities (as measured by the MSOS ETF) were up 1.52% for the week as earnings season drew to a close.
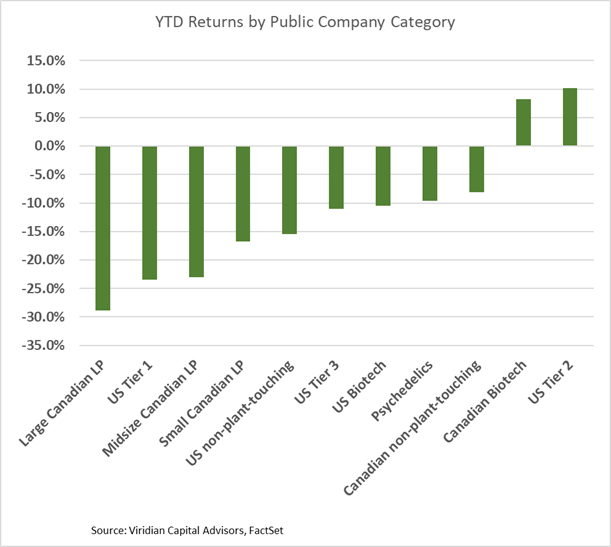
YTD Returns by Public Company Category
- The relative positions of the categories are unchanged from last week.
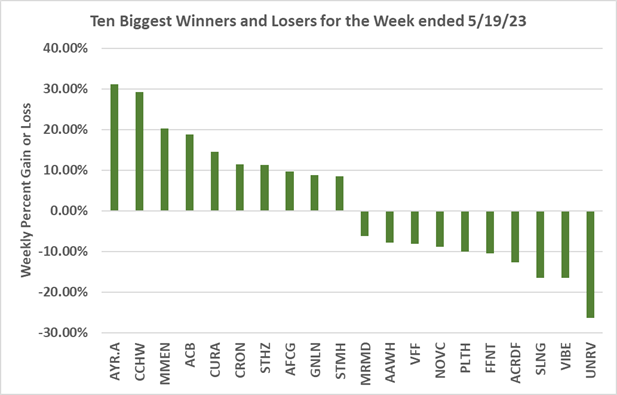
Best and Worst Performers of the last week and YTD