OUR 9TH YEAR OF PROVIDING PROPRIETARY CAPITAL MARKETS INTELLIGENCE ON THE CANNABIS / HEMP / PSYCHEDELIC SECTORS
Each week, Viridian publishes insights and analysis on completed capital raise transactions in the prior week, focusing on all equity and debt deals. Our analysis includes:
- Summary
- Outlook
- Best & Worst Perfromers
- YTD capital raises totaled $793.88M, down 8.8% from the same period in 2023. Debt as a percentage of capital raised dropped to 34.3% from 60.8% in the previous year on a worldwide basis. The U.S. bucked this trend with 72.6% of capital raised in debt compared to 49.9% in 2023
- U.S. raises accounted for 44.0% of total funds, the lowest percentage since 2019. Conversely, raises from outside the U.S. represented a historically high 9.7% of the total funds raised.
- YTD raises by public companies accounted for 63.6% of total funds.

VIRIDIAN INSIGHTS
- TILRAY FILES A $250M EQUITY SHELF FOR ATM ISSUANCE.
- On May 17, 2024, Tilray Brands (TLRY: Nasdaq) filed a prospectus supplement with the SEC for “at-market-issuance” of up to $250M in equity shares.
- Proceeds will fund “strategic and accretive acquisitions or investments, including potential acquisitions of assets in the U.S. and internationally in order to capitalize on expected regulatory advancements or expansion opportunities.”
- The wording makes it seem clear that the company must be talking about plant-touching assets since no “regulatory advancements” are necessary for them to acquire non-plant-touching assets. With rescheduling the only thing really on the table at present, we are not sure what Tilray is anticipating. But rescheduling doesn’t seem to do much in allowing Canadian ownership and operation of U.S. assets, except through a Canopyesqe holding company structure.
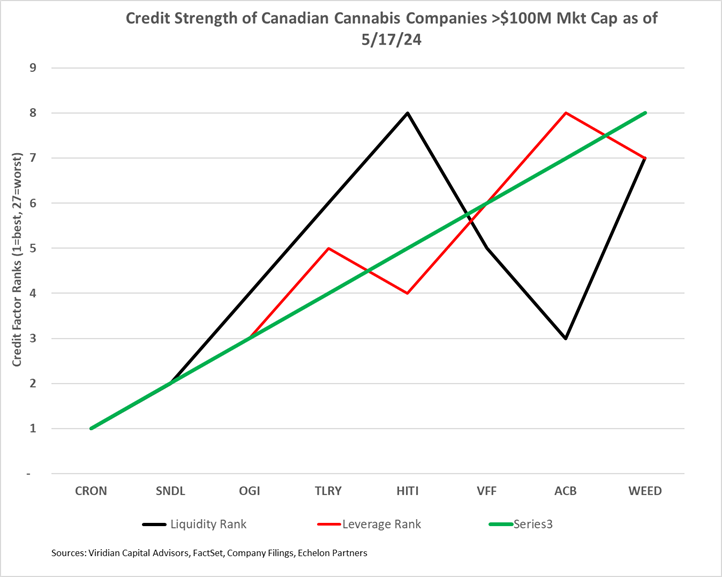
- The chart below shows that Tilray is holding onto its relatively decent credit ranking of 4/8 among large Canadian L.P.s on the Viridian Credit Model. Accretive acquisitions financed through equity issuance would likely improve the company’s credit standing and potentially its stock price.
-
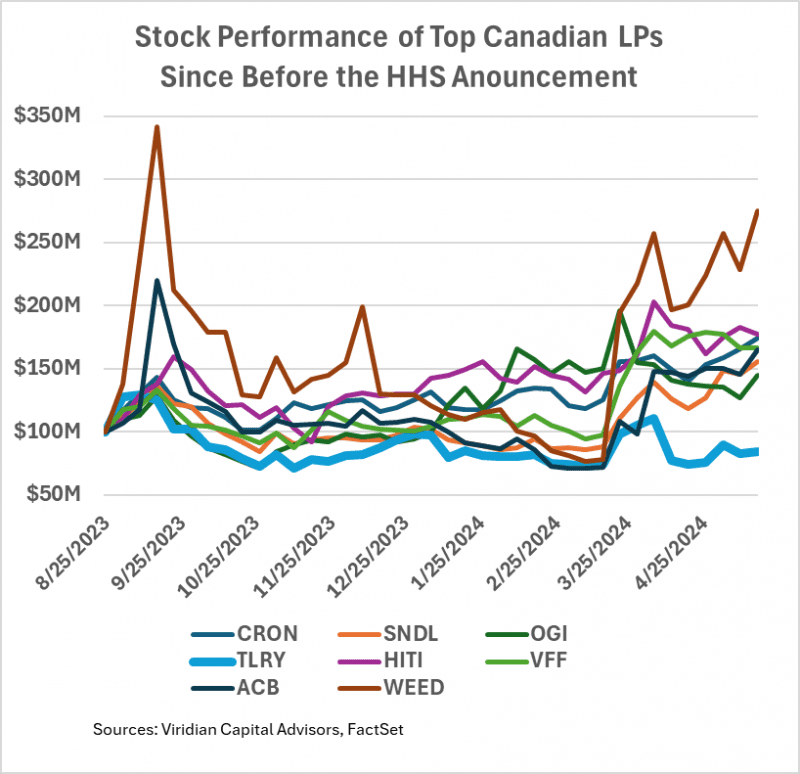
- The graph below shows the stock performance of the Canadian L.P.s with over $100M market cap since the 8/30/23 announcement by HHS recommending S3. The prices are indexed so that 8/25/23 = 100. Since rescheduling is the only proximate “expected regulatory advancement” on the table, it is curious that Tilray (the bold blue line) is the only stock that is actually trading lower than before the S3 announcement.
- What do investors fear more? Will Tilray fall behind in the quest for U.S. plant-touching assets? Or will Tilray make unproductive acquisitions that represent dead money while no appropriate legislation or regulatory action happens that allows participation in plant-touching U.S. businesses?
-
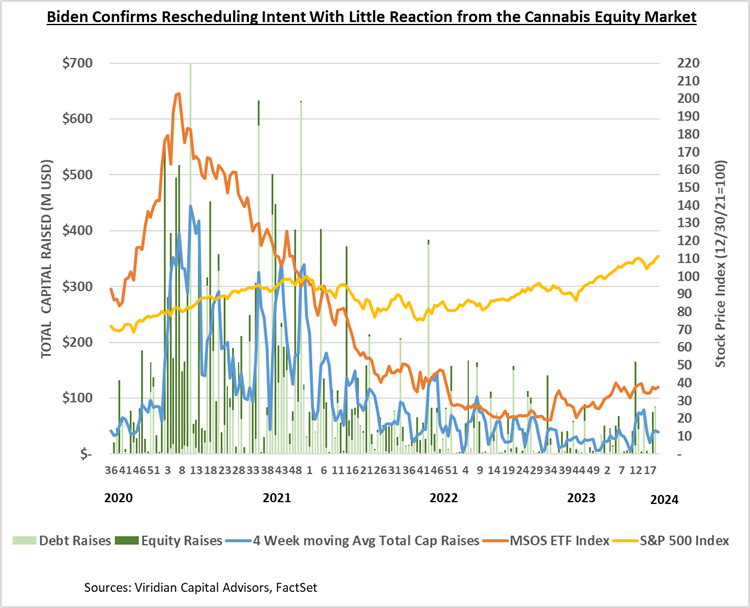
- IS IT REALLY POSSIBLE THAT RESCHEDULING WAS ANNOUNCED AND NOBODY CARED?
- On April 30, the DEA confirmed to the Associated Press that it would move to reschedule cannabis to Schedule 3 as recommended by the federal Health and Human Services Department. Furthermore, on May 16, Biden announced that the Justice Department was posting a plan to the federal register, starting the 60-day public comment period.
- The ruling is the most critical since the first state legalization, significantly improving cash flows to the industry by eliminating IRS rule 280e.
- The impacts are diverse and strongly positive:
- The industry is looking at a potential savings of $2B with more than $700M from just the top ten companies. Moreover, many of these companies are likely to start the savings program early by just not paying.
- Reinvigoration of the Cannabis Capital Markets. For the last few months, we have been talking about the cannabis capital markets being frozen due to the uncertainty surrounding rescheduling. We are now about to see the reversal of that process. Several companies have existing shelf registrations, and we expect companies to “average up” by doing minor equity issues as prices continue to recover. The debt capital markets seem to be believers, based on this week’s deal activity.
- New investors at the margin. We don’t think rescheduling by itself will bring the Blackrocks of the world to cannabis as we do not believe that it will allow uplisting to senior exchanges. Still, the greater optimism surrounding the industry’s financial footing will attract more investors who will initially be drawn to larger companies.
- A kick-save to overleveraged companies. Increased free cash flow from lower taxes has a direct impact on the sustainability of debt. We have noted that more than half of the large MSOs have more than 3x debt/2024 EBITDA, a level we believed unsustainable in a 280e world. We have noted our belief that a likely catalyst would both increase debt sustainability and provide an opportunity for re-equitization.
- A re-acceleration of industry consolidation. M&A has been in the doldrums as companies conserve cash and focus on operating for profitability rather than growth. However, the valuation gap rebounded to 3.55 on the DEA news, the second highest it has been since May 2021 (the highest was 3.71 on 2/24). This gap will grow as the markets rally further, and it indicates a growing ability for the most prominent companies to complete accretive acquisitions. We predicted a resurgence of M&A at the beginning of the year, and finally, the catalyst has occurred. The catch is that we do not see a return to deals with high cash percentages, and our chart for the week shows an uptick in stock-based consideration.
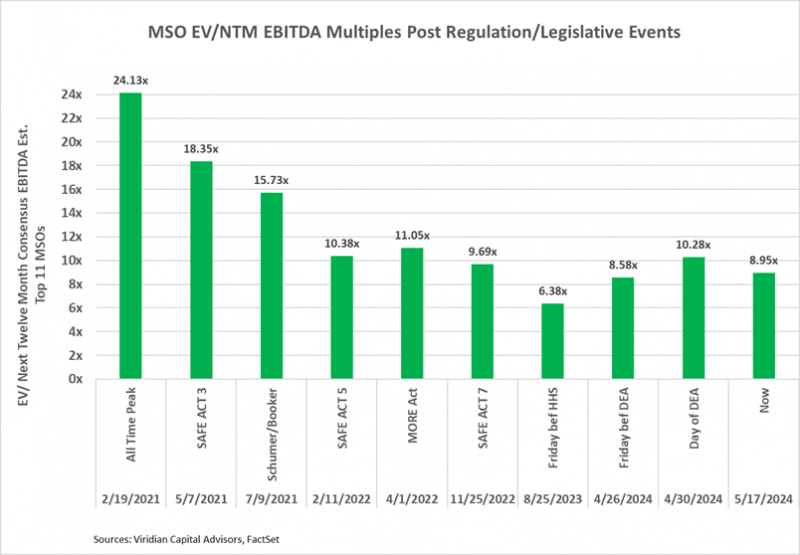
- The graph below shows the impact of past legislative/regulatory announcements on the trading multiples of cannabis companies. EV/NTM EBITDA multiples are now 8.95x, having drifted downward by 12.9% since the DEA announcement. We believe that a much higher gain is in store. Specifically, we have been saying that we expect the market to rally beyond the 15.73x multiples from the Schumer/Booker proposal, possibly reaching the 18.35x achieved in May 2021 after the 5th House passage of the Safe Act.
- Progress leads to progress. We remain skeptical about the SAFER ACT in a highly charged election year. However, rescheduling is part of a process of normalizing cannabis that we believe increases the chance of the bill. The industry potentially now has multiple shots on goal: S3, the Boies Lawsuit, SAFER, and a Garland memo. Some combinations of S3, SAFER, Boies, and Garland are becoming increasingly likely.
- So what could go wrong, and why has the stock market response been so muted? That question is even more nagging given that the Biden justice administration apparently jumped the gun on the DEA in starting the 60-day time clock.
- Investors are tired and have been spoofed too many times. When someone says, “It could take up to a year…” Cannabis investors immediately immediately think, “It’s never going to happen.” It now seems to us that it is overwhelmingly likely to happen, and the critical question is whether it will really happen as quickly as advertised.
- The investor base is heavily retail and may not fully understand the potential implications of rescheduling or the impact of the removal of 280e.
- Investors, especially institutional investors who have avoided the space, would rather miss part of the rally than jump in for another ride like the last two years. Talking to investors, rating agencies, and other constituents, we find deep distrust for administrative actions like rescheduling. It is ironic that the very lack of congressional involvement that makes S3 likely to happen also imbues it with an aura of impermanence. Like the Cole memo, the fear is that a new administration may delay implementation or even reverse course.
- Many details still need to be worked out, and investors still question how the State programs, the FDA, and Big Pharma will interact in an S3 world.
- S3 could potentially have some perverse results. The extra funds might be competed away in misplaced attempts to gain market share. Also, the additional cash could foster capacity additions that hasten oversupply and commodity price declines.
- Still, despite the uncertain timing, regulatory implementation, etc., our view is that the various regulatory, judicial, and legislative tracks for cannabis industry reforms are mutually reinforcing. We have never seen so many potential upside catalysts in any other industry.
- IS IT REALLY POSSIBLE THAT RESCHEDULING WAS ANNOUNCED AND NOBODY CARED?
- Q1 EARNINGS RELEASES ARE NOW OUT, AND ANALYSTS STILL HAVEN’T CAUGHT UP.
- Our claim since the beginning of 2024 has been that, after being burned by having to continually mark down their estimates for 2023, analysts are now too conservative on the upswing in 2024.
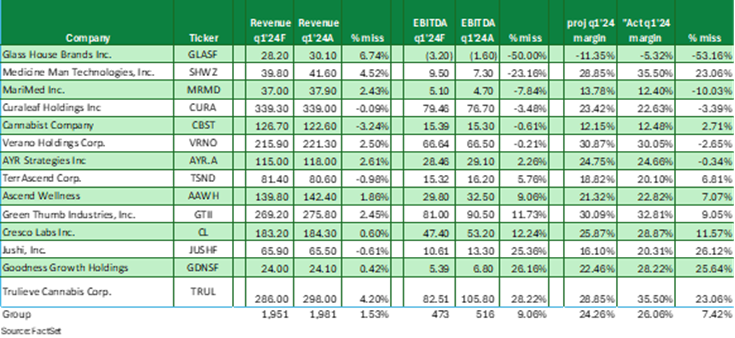
- The first chart below shows that analysts were 1.5% under on revenues but 9.1% under on EBITDA, primarily because they underestimated margins by nearly two points.
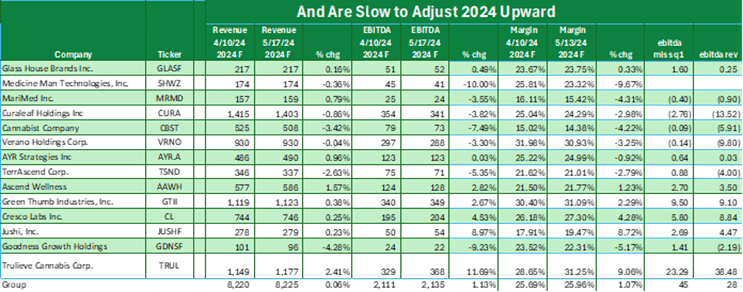
- The second chart shows that they have been slow to adjust their 2024 estimates upward. Q1 EBITDA beat expectations by $45M, but full-year EBITDA estimates have only been increased by $28M.
- 2024 Revenues for the group are now projected to rise 4.2% compared to 2023. The estimated group’s 2024 EBITDA margins of 26.0% are only 2.5 points higher than the 2023 margins and 1.5 points above the 2022 margins. Moreover, full-year margins are now projected to be lower than actual q1 margins. Q1 is a seasonally weak quarter, and margins for the group have been lower in q1 than in the whole year for each of the last two years.
- Analysts have had two weeks to catch up, but we still expect further upward revisions.
- VALUATION, LEVERAGE, AND LIQUIDITY
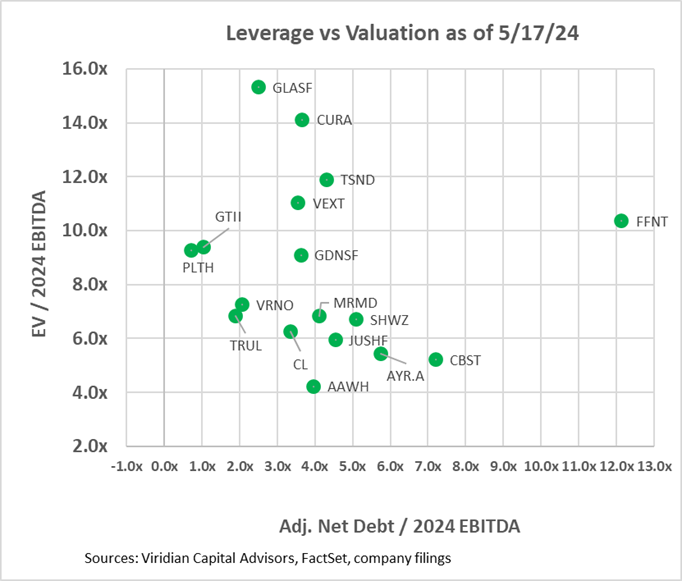
- The two graphs below show the Enterprise value to 2024 EBITDA multiples against two leverage measures. In the first graph, we have calculated an Adjusted Net Debt/ 2024 EBITDA figure by adding any accrued taxes over 90 days of tax expense to debt before subtracting cash to arrive at Adjusted Net Debt. We would expect any regular company to have accrued taxes equal to their last quarterly tax expense and consider that a standard working capital item. Several companies on the chart have far greater than 90 days of accrued taxes, and we consider the excess to be debt. Verano’s excess tax liabilities equal nearly 40% of its debt. Other companies with relatively high imputed tax debt include Curaleaf (CURA: CSE), 4Front (FFNT: CSE), and Terrascend (TSND: TSX). We have adjusted our accrued tax liabilities for comparability by adding back the tax liabilities that Trulieve and TerrAscend moved into long-term liability accounts.
- The first graph shows that ten of the seventeen companies have net debt/ 2024 EBITDA over 3x, which we view as the cutoff of sustainability in a 280e world. We view 4x as sustainable in a post-280e environment, and five companies are now over that threshold.
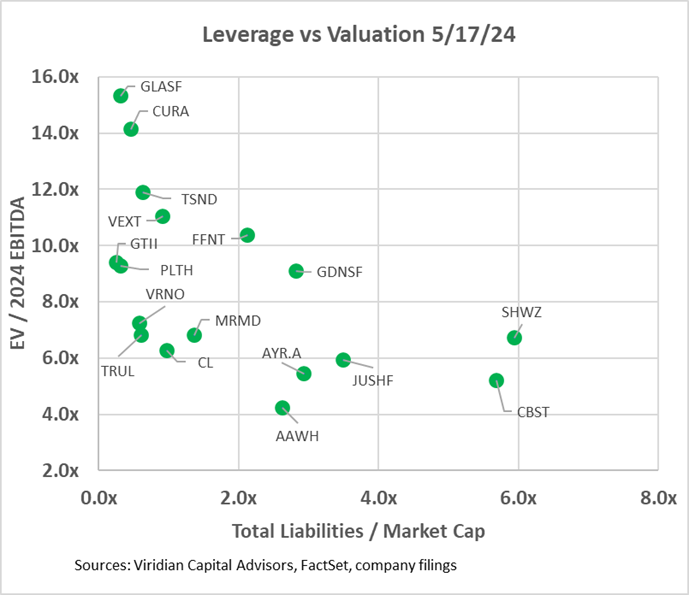
- The second graph looks at leverage through the lens of total liabilities to market cap. This measure separates the companies into three groups:
- On the bottom left are companies with low valuation multiples but also low market leverage. The group includes Verano, Trulieve, Cresco, MariMed, and Vext. With regard to Vext and MariMed, the consensus seems to be that both lack sufficient scale for the long run. Vext is small enough and geographically constrained enough to be a takeout candidate, while MariMed is priced attractively based on its fundamentals. However, it is geographically diversified enough to pose issues of overlap with potential acquirers. The other three show that the market is not yet willing to fully sign on to the Florida rec story.
- Meanwhile, in the bottom right are companies where the market has doubts about whether the company can discharge its liabilities without highly dilutive actions, like discounted stock sales or refinancing debt with a heavy warrant or share consideration.
- And in the top left, the darlings of the market. These companies have high valuation multiples and low market leverage. They have excellent currency for acquisitions but could also stand more leverage if a great debt deal were to be possible. These companies may be candidates to buy cash flow through accretive acquisitions.
- The third graph introduces the free cash flow adjusted current ratio liquidity measure into the mix. Companies with less than 1x on this measure will likely have to raise capital next year. Surprisingly, seven of the companies fall into this bucket. Note the lower liquidity position of Trulieve and TerrAscend relative to last week’s graph. This graph also breaks the sector into three distinct groupings. The bottom left group has low leverage but also modest liquidity. Some of the companies, including Verano, MariMed, and Cresco, have sufficient but not comfortable levels of liquidity, while others, including Curaleaf, TerrAscend, and Glass House, are below the critical 1x liquidity line. Companies on the lower right generally have constrained liquidity and high leverage, a potentially dangerous combination in a capital-constrained environment. Several of these have high optionality, however. Jushi, for example, is highly influenced by developments in Virginia and Pennsylvania. 4Front’s finances are dependent on the success of its massive Illinois cultivation project. AYR’s success rides heavily on Florida. Each of these companies bears careful monitoring. We know what to look for, but guessing the outcomes is nearly impossible. Ascend is a particular case and shows up on the graph in a region of its own. It looks to have excellent liquidity; however, this disguises the material debt maturities facing the company in 2025, which is just beyond the purview of our liquidity ratio.
- Looking at leverage in two ways and having a comprehensive measure of liquidity can give investors a good idea of possible scenarios for today’s overleveraged companies.
-
-
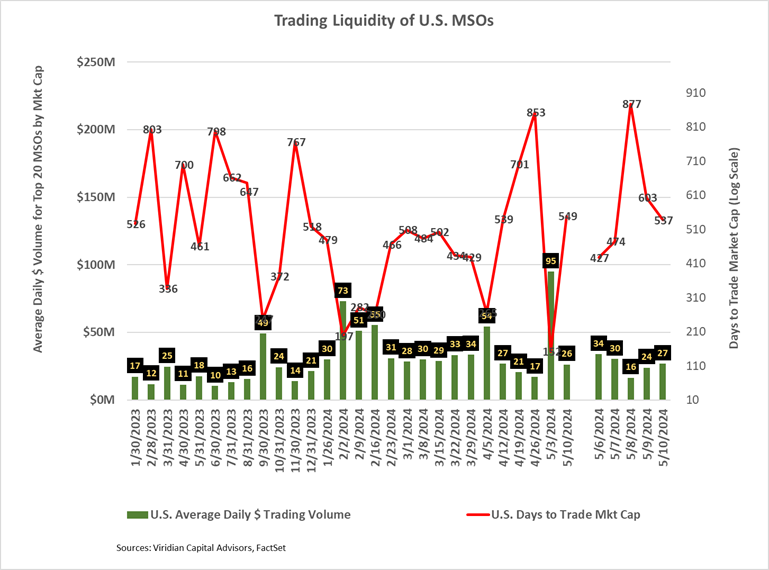
- CANNABIS STOCK LIQUIDITY RETURN TO ITS TRENDLINE PATH OF VERY SLOW IMPROVEMENT
- Average daily dollar volume dropped to an unremarkable $26M from $95M in the previous week.
- The Days to Trade Market Cap (DTTMC) series depicts the number of days it would take to trade the market cap of a stock or group of stocks. Its weekly reading on 5/10/24 of 549 days is the third worst weekly reading in 2024. A 549 DTTMC implies that an investor who acquired a 5% position in the stock, assuming he wanted to be less than 25% of the average daily dollar volume, would require 110 days to trade out of his position (down from 169 days last week.)
- The five bars on the far right show that the daily activity and liquidity readings returned to the levels before the DEA announcement.
- CANNABIS STOCK LIQUIDITY RETURN TO ITS TRENDLINE PATH OF VERY SLOW IMPROVEMENT
-
-
-
- GIVING CREDIT WHERE CREDIT IS DUE
- The chart below shows our updated 5/17/24 credit rankings for the 30 U.S. cannabis companies with over $5M market cap. The number below the ticker symbol indicates the change in credit ranking since last week, where a negative number suggests credit deterioration, while a positive indicates improvement.
- The blue squares show the offered-side trading yields for each company. Trading yields have declined significantly since the HHS rescheduling announcement.
- The yield spread between Trulieve and GTI has widened to around 230 bp, which we view as being too wide. We also continue to believe GTI’s absolute yield level of 7% seems too tight relative to treasuries. We have no question that GTI is the best credit for the group, but investors can now pick up nearly 440 basis points by trading into Verano paper.
- Ascend paper, which we had been recommending due to its undeserved 230 bp spread to Verano, has tightened and now trades virtually on top of Veraono. We now recommend trading out of Curaleaf into Verano for a 140bps yield increase and a three-notch better credit ranking.
- Schwazze (SHWZ: OTCQX) lost another four ranking spots to #24 and has been deteriorating since at least the end of the second quarter when it ranked 11/30. Both leverage and liquidity measures have deteriorated relative to the group, and the company’s 5.83x total liabilities/ market cap (# 25/30) is concerning, just above Acreage, Slang, RWB, Tilt, and StateHouse.
- GIVING CREDIT WHERE CREDIT IS DUE
-

- Cannabis equities (as measured by the MSOS ETF) ended up 2.89% for the week.
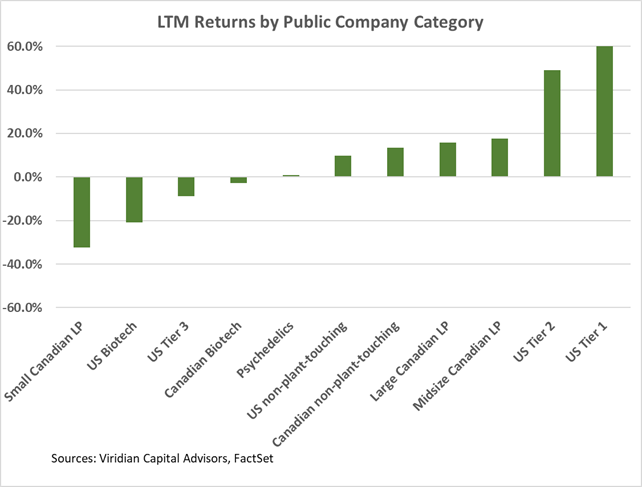
Trailing 52-Week Returns by Public Company Category:
- U.S. Tier One MSOs are now up approximately 60% for the LTM period, and Large Canadian L.P.s are now up around 17%.

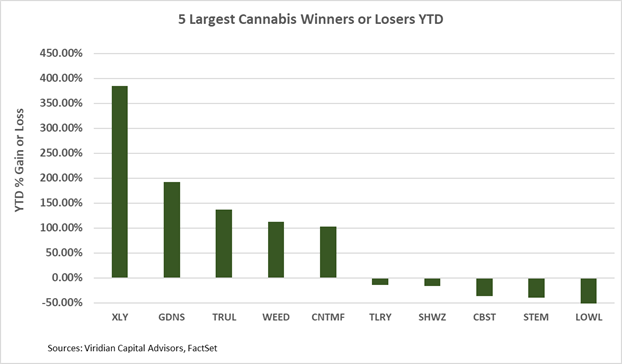
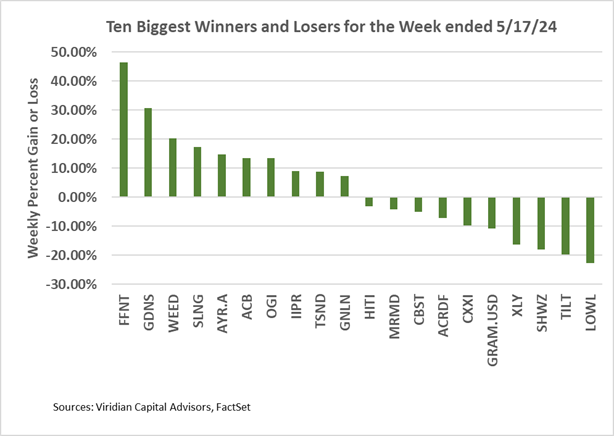
Best and Worst Performers of the last week and YTD:
- The week’s gainers list included a liberal sprinkling of Canadian names, including Canopy, Aurora, Organigram, and High Tide. We are not sure which had the more significant impact: Biden’s announcement on S3 or the return of “Roaring Kitty.”
- The week’s losers included 20% down moves by both Tilt Holdings and Lowell Farms. Tilt announced an expensive debt deal last week, on which we gave a mixed review. It enables the company to get vertical in P.A., which is a crucial step ahead of adult rec. Our primary concern is the language in the press release, which states that Tilt can only prepay any debt drawn down on the line with the lender’s approval.