OUR 9TH YEAR OF PROVIDING PROPRIETARY CAPITAL MARKETS INTELLIGENCE ON THE CANNABIS / HEMP / PSYCHEDELIC SECTORS
Each week, Viridian publishes insights and analysis on completed capital raise transactions in the prior week, focusing on all equity and debt deals. Our analysis includes:
- Summary
- Outlook
- Best & Worst Perfromers
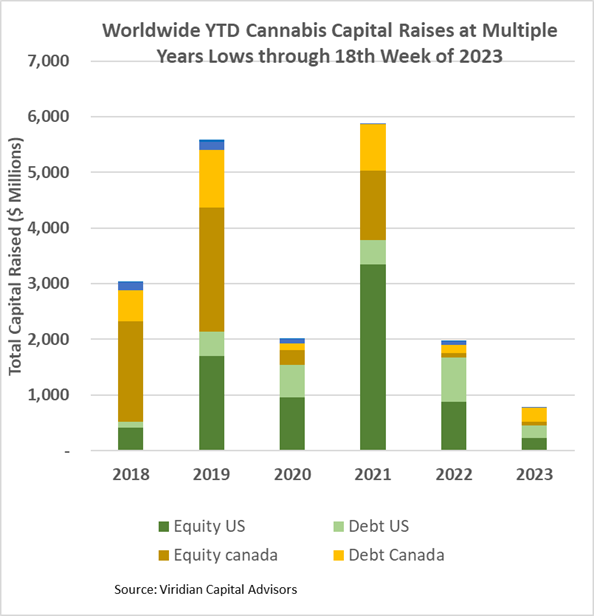
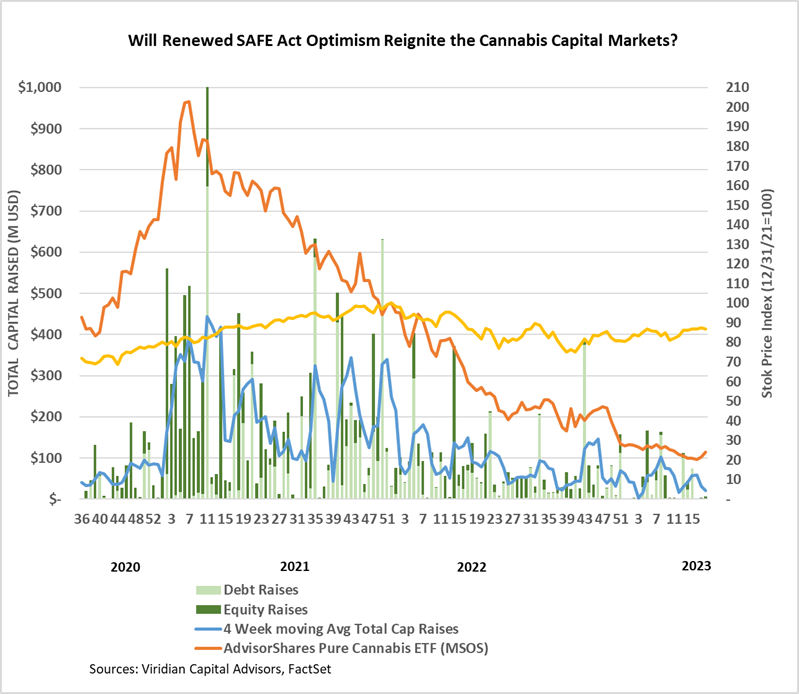
- Cannabis capital raises are off to a multi-year low. Only $788.14M closed through the first eighteen weeks of the year compared to $1,972.45M last year.
- Debt represents 62.2% of total capital raised, higher than in any other comparable period back to 2018.
- Public companies have raised only 61.5% of total capital YTD, down from 77.4% last year.
VIRIDIAN INSIGHTS
- Are cannabis equities behaving rationally concerning the prospects of the SAFE Act passage? The MSOS ETF price graph shows how muted the rally has been, and we think that is appropriate. The ACT’s impact would be more symbolic than actual, at least in the near term. Most public and private cannabis companies already have access, albeit at high costs, to banking services, and that aspect of the SAFE Act doesn’t strike us as being particularly significant. However, we believe the SAFE Act would eventually lead to uplistings and greater trading liquidity, which would have tangible benefits, particularly for larger MSOs. Major banks are unlikely to storm into the market on the lending side, given the cash flow challenges poised by 280e and wholesale price compression. At the margin, lending may loosen, but this needs to be viewed against the backdrop of general credit contraction, an upcoming recession, and high drama regarding the debt ceiling. Frankly, it is remarkable that with these issues facing the country, the ACT is even getting a hearing, but maybe the eighth time is the charm.
- We are seeing a dramatic price uplift in some of the most beat-up cannabis markets, including Michigan and California. Some industry watchers attribute this to increased law enforcement, but we are skeptical. The prospect of a new war on drugs being effective, particularly in Democratic-controlled states, is implausible. Enforcement has never worked in the past, and it is unlikely to be effective now. Instead, we see market forces at work. The failure of a significant number of competitors with the temporary attendant reduction in supply is the likely agent for the increased pricing and tight supply conditions. Will that last? Yes, for one outdoor crop cycle, and then we will see.
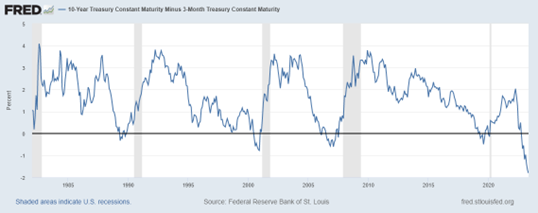
- The 10-year minus 3-month yield spread at -176bps has become less inverted by four basis points, and the regional banking crises seems to have drifted out of the headlines for a week. However, none of the issues have been solved. The Fed has a three-sided problem; taming inflation is only one side. The Fed has aspirations beyond taming the inflation rate. Its fundamental goal is to tame the all-asset price bubble produced by a decade of zero interest rates. To achieve that goal, the Fed is not only not afraid of a recession but practically requires one. The market is naïve to think the Fed is going to pivot quickly. A Fed near-term pivot would be pretty terrifying; in our opinion, it would signal that the Fed perceives an imminent threat of banking contagion or severe economic weakness. Brinksmanship over the debt ceiling adds extra drama.
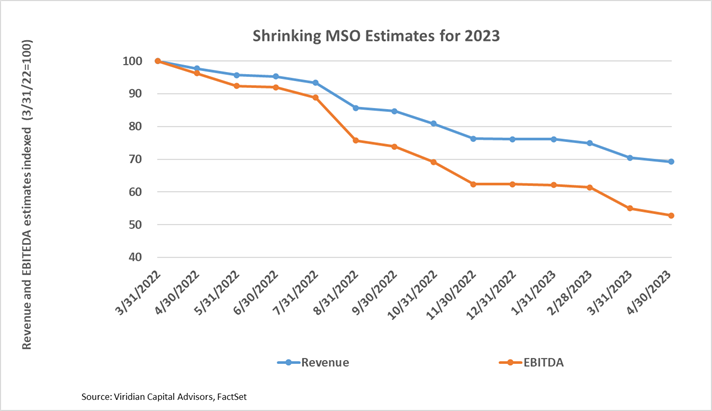
- We are heading into earnings season again, with many cannabis companies releasing Q1 results in the weeks ahead. We are not as focused on the beats or misses in these reports as in the revisions to the 2023 and 2024 estimates that result. We are looking for a flattening of the curve below, showing downward revisions to 2023 revenues and EBITDA for 15 of the largest MSOs. Since March 31, several companies have had significant downward revisions to consensus EBITDA estimates, including 4Front (FFNT: CSE), down 11.8%; Cresco (CL: CSE), down 6.1%; Jushi (JUSHF: CSE), down 8.3% and Curaleaf (CURA: CSE) down 17.6%. Aside from the psychological boost of the SAFE Act drama, it is hard to see a real price resurgence as long as these estimates are revised downward.
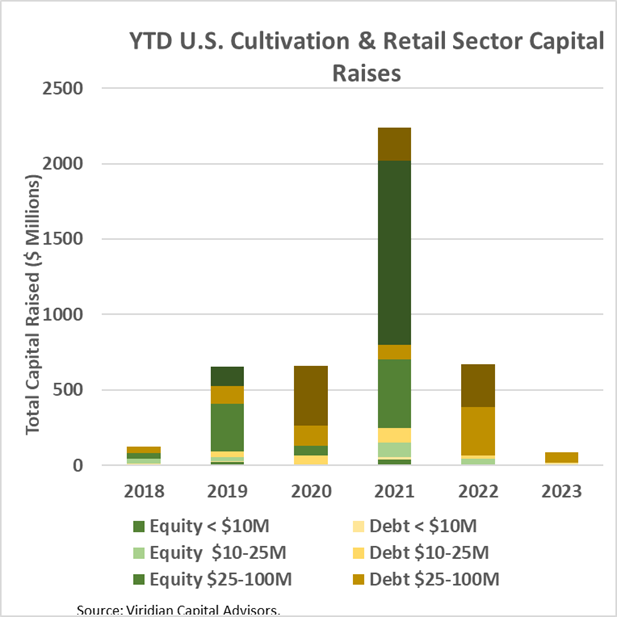
- YTD, U.S. Cultivation & Retail sector capital raises are down 87.3% from 2022.
- Debt is still the only game in town, accounting for 89.4% of all cultivation sector capital raised. All the debt raised YTD has been for public companies.
- Large transactions are still absent from the market. There have been no debt or equity deals over $100M YTD.
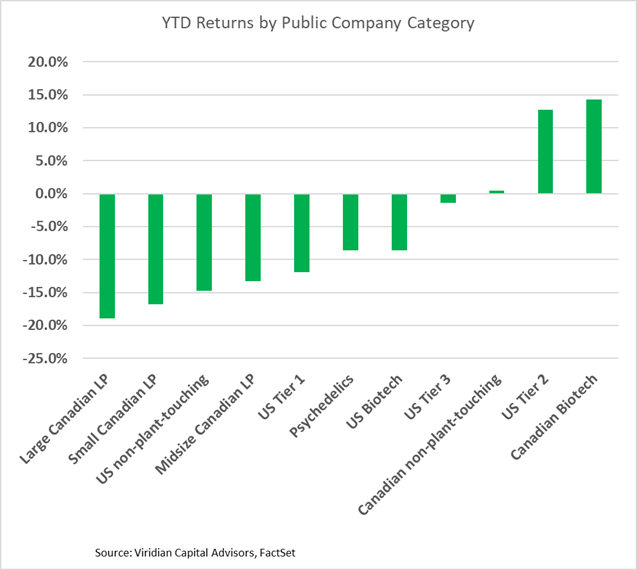
- Cannabis equities (as measured by the MSOS ETF) were up 11.75% for the week on increasing SAFE Act talk. The gain was the largest since 10/21/22.
YTD Returns by Public Company Category
- Tier one and two U.S. MSOs advanced several positions based on the renewed SAFE Act buzz. Tier two companies were solid performers, with Jushi (JUSHF: OTC), Ascend (AAWH: OTC), Glass House (GLASF: OTC), and MariMed (MRMD: OTC) all registering greater than 20% gains for the week.
Best and Worst Performers of the last week and YTD
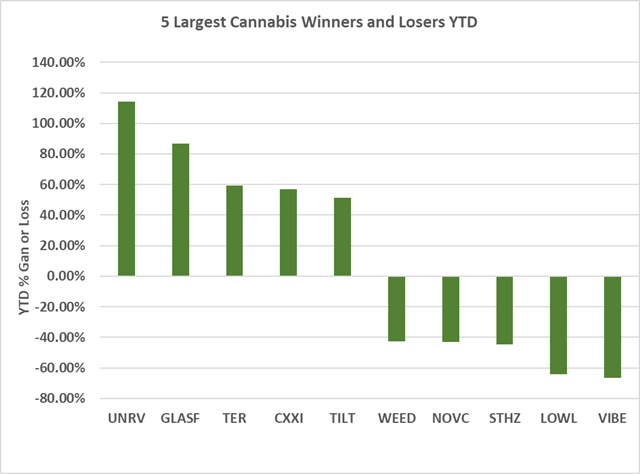
- The graph below shows the relative performance of the top five and bottom five performing U.S. Cannabis companies from the beginning of 2023.
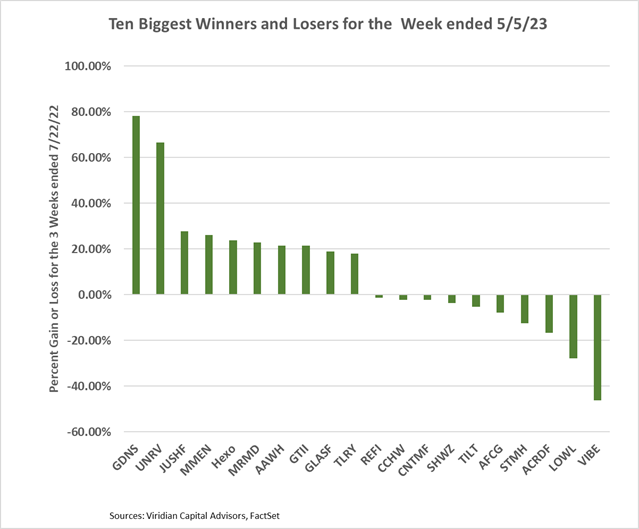
- Unrivaled Brands (UNRV: OTC) rose 66.7% on the week to become the best YTD performer on our list, based on the successful closing of a settlement that extinguished an aggregate of $4.5M of liabilities in exchange for $1.25M of long maturity unsecured notes.
- Goodness Growth (GDNS: OTC) was the week’s biggest gainer, up 78% on closing the first tranche of a $10M convertible note facility detailed in the new debt issue section below.