OUR 9TH YEAR OF PROVIDING PROPRIETARY CAPITAL MARKETS INTELLIGENCE ON THE CANNABIS / HEMP / PSYCHEDELIC SECTORS
Each week, Viridian publishes insights and analysis on completed capital raise transactions in the prior week, focusing on all equity and debt deals. Our analysis includes:
- Summary
- Outlook
- Best & Worst Perfromers
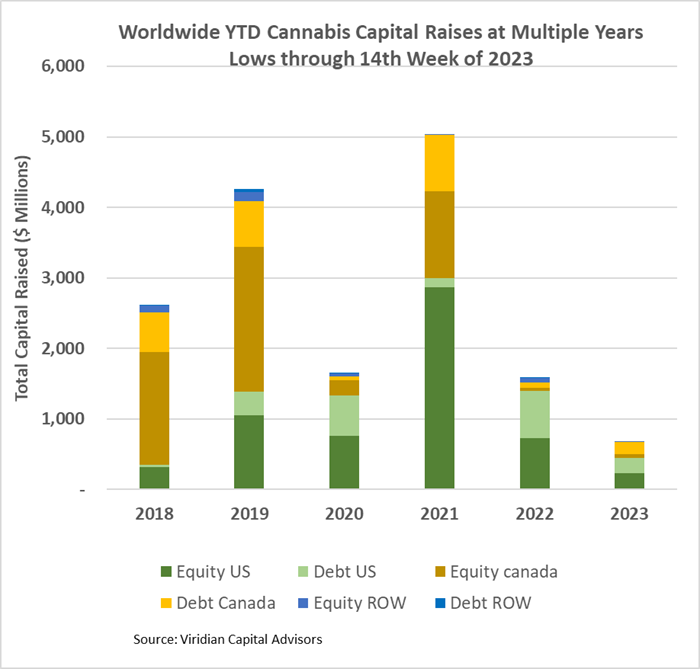
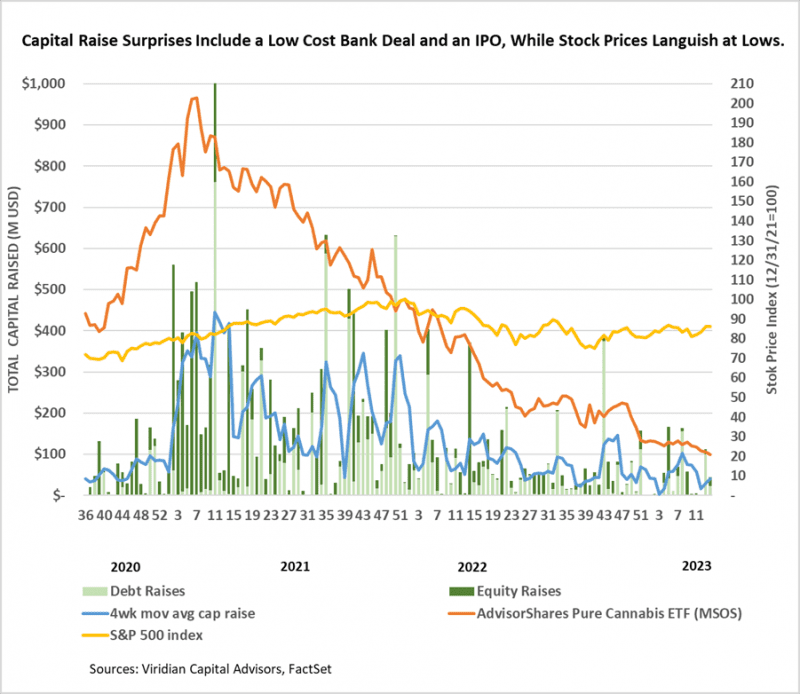
- Cannabis capital raises are off to a multi-year low. Only $680.00M closed through the first fourteen weeks of the year compared to $1,585.01M last year.
- Debt represents 57.3% of total capital raised, higher than in any other comparable period back to 2018.
- Public companies have raised only 54.7% of total capital YTD, down from 77.0% last year.
VIRIDIAN INSIGHTS
- Tilray (TLRY: Nasdaq) surprised us by announcing it was acquiring 100% of the shares of HEXO (HEXO: Nasdaq). The transaction combines the conversion of its senior secured convertible debentures for approximately 49% of the company and tendering for the remaining shares. We can’t imagine HEXO’s shareholders will turn down what may be the last kick save of the game. What we don’t understand is why Tilray would do it. Tilray’s shareholders would be better served by following a similar strategy to the one employed by Gotham Green with its position in MedMen. There is no good reason to give up a secured debt position by early conversion. Gotham was more strategic, feeding MedMen the minimum amount of liquidity to keep it going while maintaining its secured debt position (and hoping for some legislative miracle). Why give up the optionality? Tilray gains no benefit from consolidating HEXO’s results except for an ephemeral boost in sales.
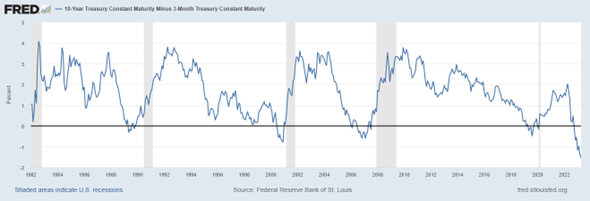
- The yield curve continues to be more inverted than it’s been for 20 years, yet we still believe that the Fed will continue raising rates. We are unsure what it will take for the Fed pivot theme to get beaten out of the market.
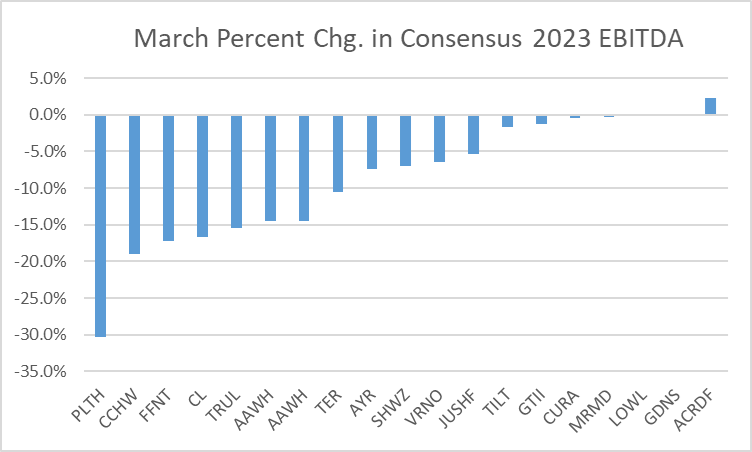
- We took a fair amount of solace from our review of 2023 EBITDA estimates, post-4th quarter releases. Forecasts for 2023 are significantly lower than estimates for 2022 were at this time last year, and they are only about 9% higher than actual 2022 results. We want to believe that moderating expectations may leave room for some upside surprises.
- However, we need to see the end of downward revisions to form a solid bottom. The chart below shows the revisions to the consensus 2023 EBITDA estimates for March 2023. Eight of the 19 companies on the chart had downward revisions of more than 10%, and only one had an upward revision. Those of you who saw our Viridian Chart of the Week are familiar with the Airport Flight Delay Theorem, which says that downward revisions are most often followed by more downward revisions…
- YTD, US Cultivation & Retail sector capital raises are down 86.2% from 2022.
- Debt is still the only game in town, accounting for 89.4% of all cultivation sector capital raised. The vast majority of the debt raised has been for public companies.
- Large transactions are still absent from the market. There have been no debt or equity deals over $100M YTD.

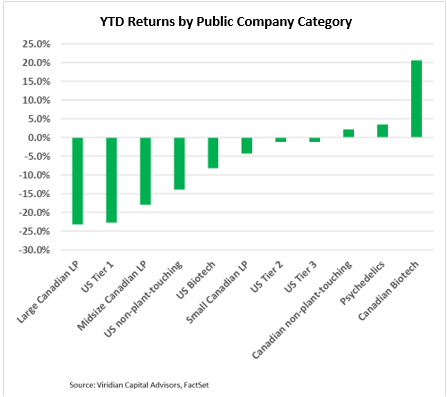
YTD Returns by Public Company Category
- All three tiers of U.S. MSOs now have negative YTD returns, and the large Canadian L.P.s and Tier One U.S. MSOs are the two worst-performing categories. Eight of our eleven categories are now showing YTD losses.
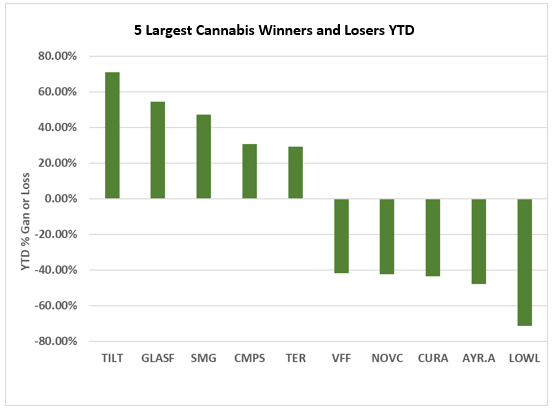
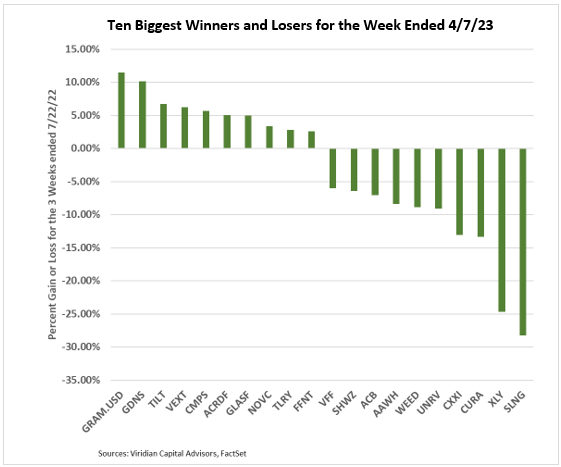
Best and Worst Performers of the last week and YTD
- The surprise here is the addition of Curaleaf (CURA: CSE) to the top YTD losers list. The cause may be some combination of the company’s premium valuation to peers, strategic retreat from Western markets, or the delay in filing the year-end results.