OUR 9TH YEAR OF PROVIDING PROPRIETARY CAPITAL MARKETS INTELLIGENCE ON THE CANNABIS / HEMP / PSYCHEDELIC SECTORS
Each week, Viridian publishes insights and analysis on completed capital raise transactions in the prior week, focusing on all equity and debt deals. Our analysis includes:
- Summary
- Outlook
- Best & Worst Perfromers
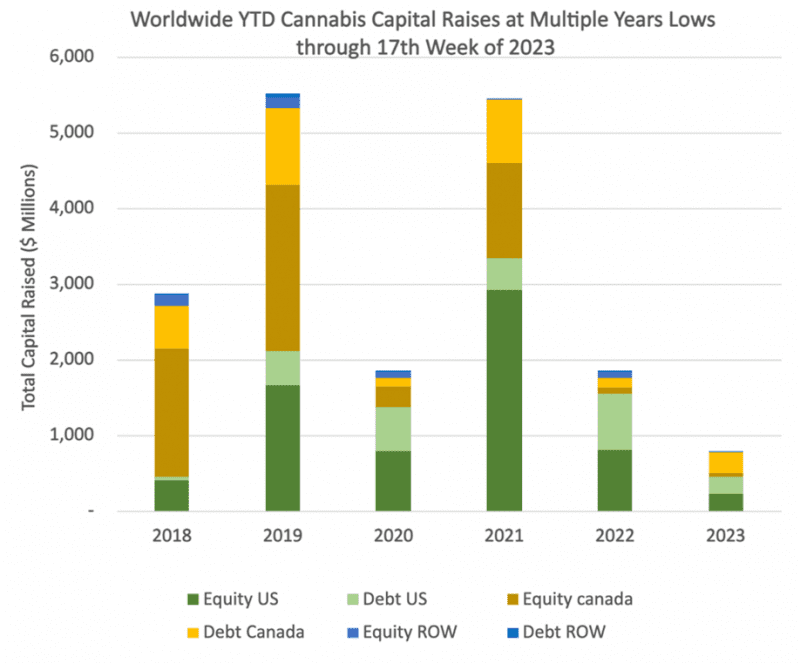
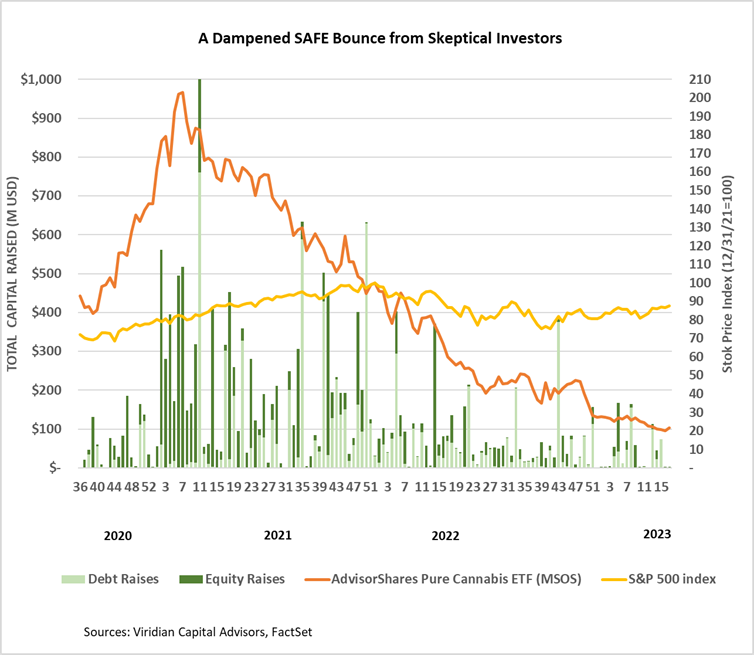
- Cannabis capital raises are off to a multi-year low. Only $782.16M closed through the first seventeen weeks of the year compared to $1,836.51M last year.
- Debt represents 62.4% of total capital raised, higher than in any other comparable period back to 2018.
- Public companies have raised only 61.6% of total capital YTD, down from 77.4% last year.
VIRIDIAN INSIGHTS
- Most industry participants believe that cannabis pricing is irrationally low relative to the industry’s growth potential. It seemed like an insult added to injury that the MSOS ETF could close at its all-time low on the number one weed holiday, 4/20. As investors, we are constantly reminded of the quote from Keynes, “The markets can stay irrational longer than you can stay solvent.”
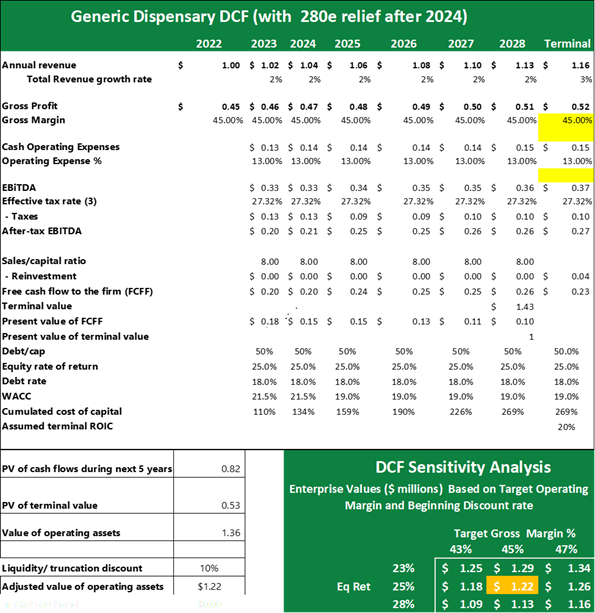
- Last week we presented the analysis below to show a “rough and ready” valuation of a steady-state dispensary at around 1.2x revenues or 4x EBITDA. We were intrigued by the structure of Glass House Brands’ purchase of the Turlock dispensary this week for ostensibly 6x EBITDA. We guess the discrepancy may relate to the fact that most CA dispensaries are not making 32% EBITDA margins as we assumed in our model. If the dispensary made 20% margins, 6x EBITDA would return to 1.2X revenues, close to what we calculated.
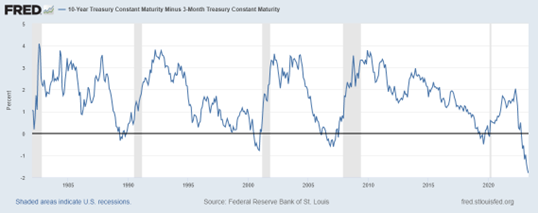
- The 10-year minus 3-month yield spread at -180bps continues to become more inverted, depicting the plight of the mid-sized banks. If the banks match the money market rates to arrest the outflow of funds, they face negative interest spreads on their loans. The Fed has a three-sided problem; taming inflation is only one side. The Fed has aspirations beyond taming the inflation rate. Its fundamental goal is to tame the all-asset price bubble produced by a decade of zero interest rates. To achieve that goal, the Fed is not only not afraid of a recession but practically requires one. That would be a difficult enough tradeoff, but now we see the third issue: rapid short-end rate increases have bent the curve and threaten either the profitability or the very existence of mid-sized banks. Throw in the upcoming political theatre surrounding the debt ceiling, the silliness of an election year, and impending commercial real estate problems. Cannabis is starting to look a lot better!
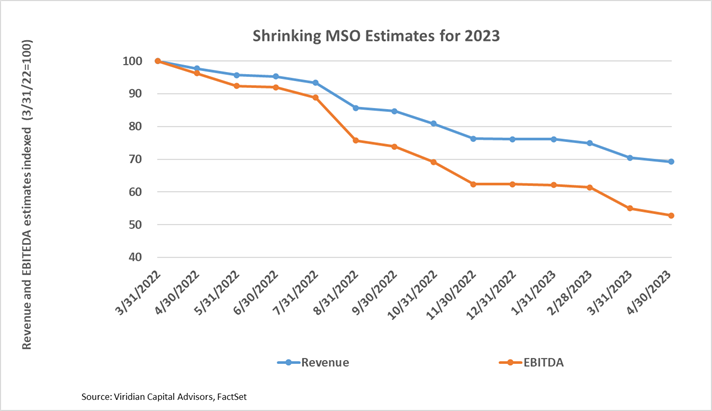
- The graph below shows the reduction in consensus 2023 revenue and EBITDA estimates for the top 15 MSOs over the last twelve months. 2023 EBITDA estimates are about 53% of what they were a year ago. The widening gap between the revenue and EBITDA lines shows the negative margin impact of wholesale price pressures matched with inflationary cost increases. As we near the release of Q1 earnings, our immediate attention will be on these revisions and, hopefully, a flattening of this curve. We are not there yet, though; the gap widened an additional 2pts this week as Curaleaf (CURA: CSE) and Acreage (ACRDF: CSE) released 4th quarter results this week, and analysts cut 2023 EBITDA estimates by an additional 5.8% and 13.5% respectively.
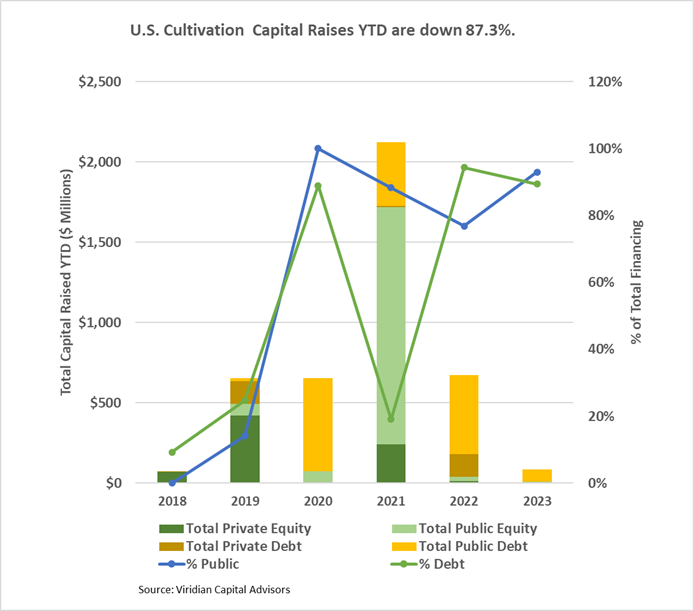
- YTD, U.S. Cultivation & Retail sector capital raises are down 87.3% from 2022.
- Debt is still the only game in town, accounting for 89.4% of all cultivation sector capital raised. All of the debt raised YTD has been for public companies.
- Large transactions are still absent from the market. There have been no debt or equity deals over $100M YTD.
- Cannabis equities (as measured by the MSOS ETF) were up 7.4% for the week after the SAFE Act was reintroduced.
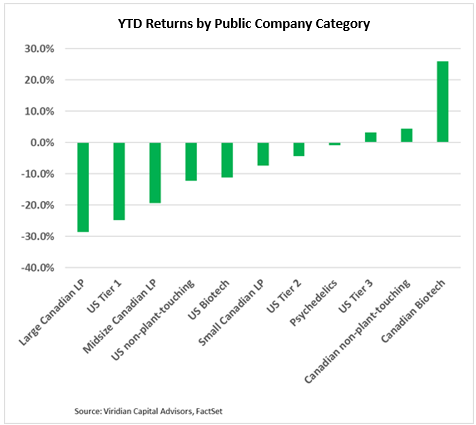
YTD Returns by Public Company Category
- Tier one and Tier two U.S. MSOs have negative YTD returns, while Tier three is hanging on to a slim 3% YTD gain. Eight of our eleven categories are now showing YTD losses.
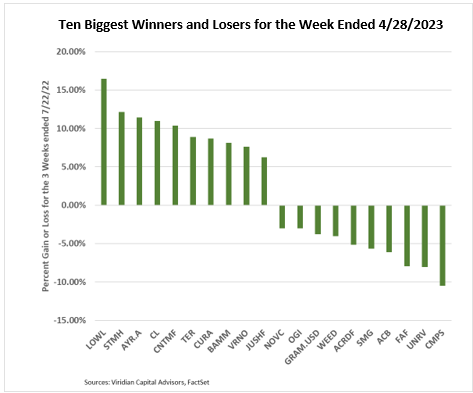
Best and Worst Performers of the last week and YTD
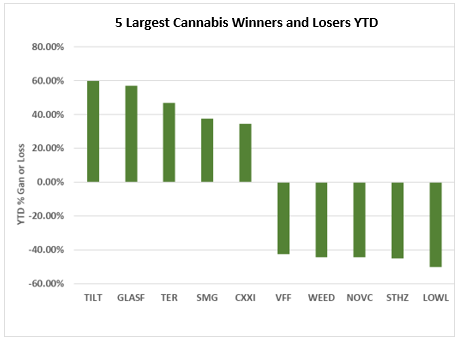
- The graph below shows the relative performance of the top five and bottom five performing U.S. Cannabis companies from the beginning of 2023.
- The top performers of the week were divided into two groups. The Tier one MSOs like Curaleaf (CURA: CSE) and TerrAscend (TER: CSE) faired better than most small competitors because they stand to gain the most from the indirect impacts of SAFE, which we believe will eventually lead to uplisting. Others like AYR (AYR.A: CSE) gained from increased optimism which might foster a reopening of the cannabis capital markets.