OUR 9TH YEAR OF PROVIDING PROPRIETARY CAPITAL MARKETS INTELLIGENCE ON THE CANNABIS / HEMP / PSYCHEDELIC SECTORS
Each week, Viridian publishes insights and analysis on completed capital raise transactions in the prior week, focusing on all equity and debt deals. Our analysis includes:
- Summary
- Outlook
- Best & Worst Perfromers
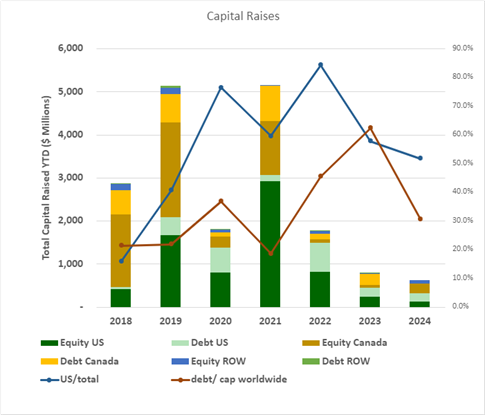
- The U.S. raises accounted for 51.8% of total funds, the lowest percentage since 2019. Conversely, raises from outside the U.S. and Canada, spurred by a sizeable psychedelic equity raise in the U.K., represented a historically high 12.6% of the total funds raised.
- YTD raises by public companies accounted for 68.4% of total funds.
VIRIDIAN INSIGHTS
- VIRIDIAN INSIGHTS
- THE DEA FINALLY COMES THROUGH!
- On April 30, the DEA confirmed to the Associated Press that it will move to reschedule cannabis to Schedule 3 as recommended by the federal Health and Human Services Department.
- The ruling is the most critical since the first state legalization, significantly improving cash flows to the industry by eliminating IRS rule 280e.
- The impacts are diverse and strongly positive:
- A massive increase in industry cash flow. In our 2024 outlook in January, we affirmed our belief that rescheduling would happen. We estimated that the top 10 companies alone would save over $700M annually from eliminating 280e and that the industry at large would save more than twice that amount.
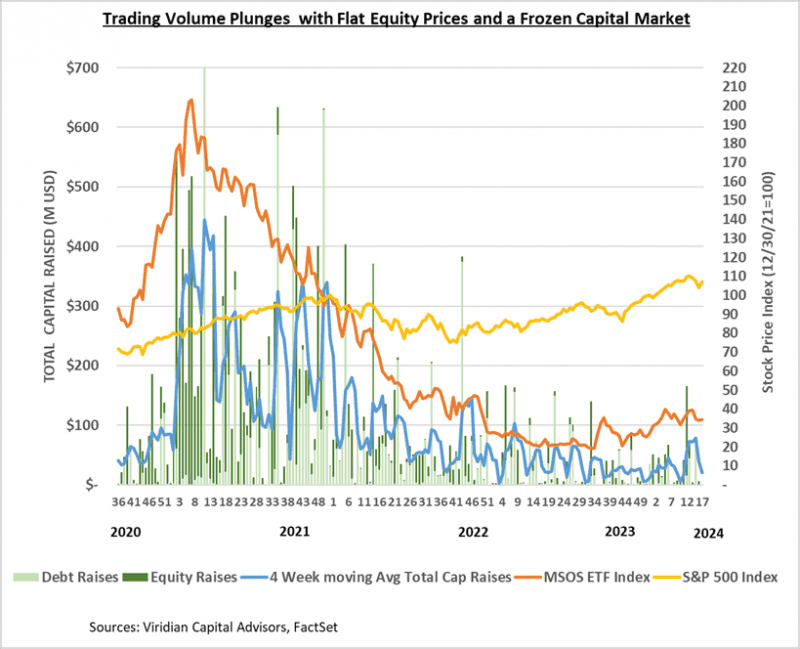
- Reinvigoration of the Cannabis Capital Markets. For the last few months, we have been talking about the cannabis capital markets being frozen due to the uncertainty surrounding rescheduling. We reasoned that no CFO wanted to be “that guy” who raised equity at the bottom. We are now about to see the reversal of that process. Several companies have existing shelf registrations, and we expect companies to “average up” by doing small equity issues as prices continue to recover.
- New investors at the margin. We don’t think rescheduling by itself will bring the Blackrocks of the world to cannabis. Still, the greater optimism surrounding the industry’s financial footing will attract more investors who will initially be drawn to larger companies.
- A kick-save to overleveraged companies. Increased free cash flow from lower taxes has a direct impact on the sustainability of debt. We have noted that more than half of the large MSOs have more than 3x debt/2024 EBITDA, a level we believed unsustainable in a 280e world. We have noted our belief that a likely catalyst would both increase debt sustainability and provide an opportunity for re-equitization.
- A re-acceleration of industry consolidation. M&A has been in the doldrums as companies conserve cash and focus on operating for profitability rather than growth. However, the valuation gap rebounded to 3.55 on the DEA news, the second highest it has been since May 2021 (the highest was 3.71 in 2/24). This gap will grow as the markets rally further, and it indicates a growing ability for the most prominent companies to complete accretive acquisitions. We predicted a resurgence of M&A at the beginning of the year, and finally, the catalyst has occurred.
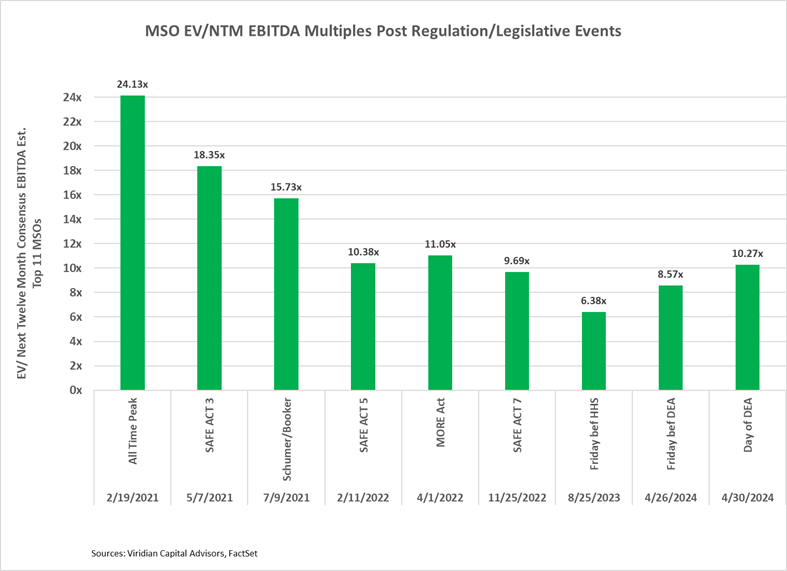
- The graph below shows the impact of past legislative/regulatory announcements on the trading multiples of cannabis companies. EV/NTM EBITDA multiples rose nearly 20% on Tuesday to 10.22x following the DEA news. But we believe that a much higher gain is in store. Specifically, we have been saying that we expect the market to rally beyond the 15.73x multiples from the Schumer/Booker proposal, possibly reaching the 18.35x achieved in May 2021 after the 5th House passage of the Safe Act.
- Progress leads to progress. We remain skeptical about the SAFER ACT in a highly charged election year. However, rescheduling is part of a process of normalizing cannabis that we believe increases the chance of the bill.
- THE DEA FINALLY COMES THROUGH!
- FINALLY, A US/CANADIAN M&A DEAL THAT MAKES SENSE
- We have been skeptical, at best, about the announced Canadian acquisitions of U.S. assets to date.
- The timing of federal legalization that would actually allow the operation of these assets remains highly uncertain, and we guess that it is still years away.
- The ability of the Canadian L.P.s to utilize somewhat marginal acquired assets as beachheads to compete in the U.S. against entrenched, profitable MSOs has always seemed dubious.
- We must admit that upon hearing of this week’s completed Curaleaf acquisition of Northern Green Canada, our first impression was, WHAT?? Why spend money to enter a territory where few companies are actually making money?
- But this deal makes abundant sense:
- NCG gives Curaleaf non-irradiated, indoor GMP flowers to sell in Europe. The acquisition dovetails nicely with the company’s expandable cultivation capacity in Portugal.
- NGC also exports products to Australia and establishes Curaleaf’s presence there.
- The purchase price of $16M is an insignificant sum for Curaleaf, and CURA stated that the acquisition would be immediately accretive.
- The acquisition is a winner both strategically and financially
- Although Curaleaf stands nearly alone among the top MSOs in terms of international expansion. We would not be surprised to see other transactions like this one throughout 2024.
- We have been skeptical, at best, about the announced Canadian acquisitions of U.S. assets to date.
-
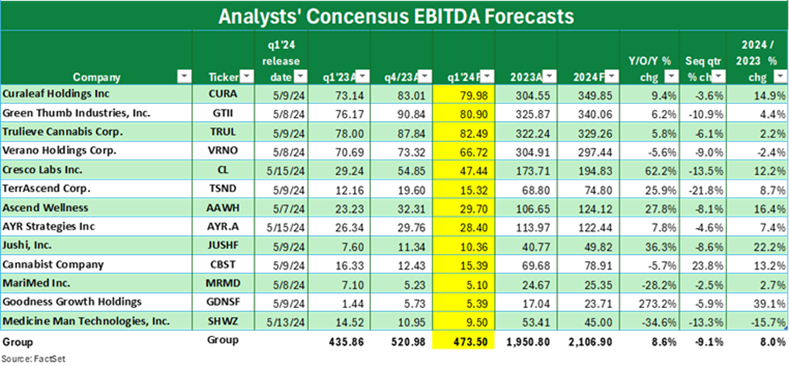
- ANALYSTS PLAY IT SAFE ON REVENUES AND MARGiNS
- The chart below shows the consensus EBITDA estimates for Q1 2024 (in yellow) and compares them with the first quarter of 2023 and the fourth quarter of 2023.
- The sequential quarter growth is negative for 12 of the 13 companies on the chart, reflecting seasonality. The 9.1% sequential decline is somewhat higher than last year’s 5.8% drop but in line with 2022’s 8.1% decline.
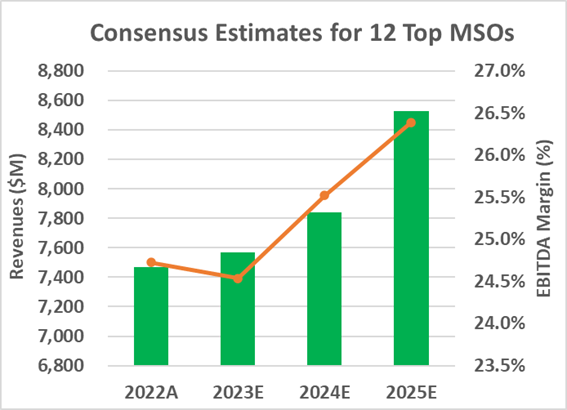
- Projected year-over-year EBITDA growth for Q1 is 8.6%, with 8.0% projected for the full year 2024. The graph below the chart shows that this EBITDA growth is driven by roughly a 1-point increase in EBITDA margins combined with about 4% growth in revenues. A half-year of Ohio and continued growth in Missouri and Maryland could send sales above these targets.
- Similarly, a one-point margin increase seems a rather conservative forecast, following on the heels of a margin decline in 2023.
- The risk to further upside lies in the potential for stubborn inflation to drive costs higher while prices remain flat to slightly down.
- ANALYSTS PLAY IT SAFE ON REVENUES AND MARGiNS
-
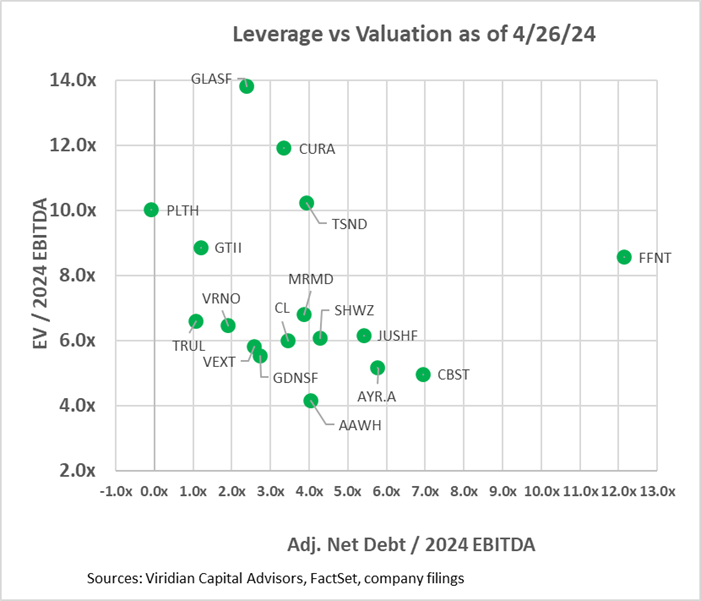
- VALUATION, LEVERAGE, AND LIQUIDITY
- The two graphs below show the Enterprise value to 2024 EBITDA multiples against two leverage measures. (Note: The graphs have not yet been revised to account for the impact of the DEA announcement. We will update them over the next few days) In the first graph, we have calculated an Adjusted Net Debt/ 2024 EBITDA figure by adding any accrued taxes over 90 days of tax expense to debt before subtracting cash to arrive at Adjusted Net Debt. We would expect any regular company to have accrued taxes equal to their last quarterly tax expense and consider that a standard working capital item. Several companies on the chart have far greater than 90 days of accrued taxes, and we consider the excess to be debt. Verano’s excess tax liabilities equal nearly 40% of its debt. Other companies with relatively high imputed tax debt include Curaleaf (CURA: CSE) and 4Front (FFNT: CSE) at 19%, and Terrascend (TSND: TSX) at 17%. We have adjusted our accrued tax liabilities for comparability by adding back the tax liabilities that Trulieve and TerrAscend moved into long-term liability accounts.
- The first graph shows that ten of the seventeen companies have net debt/ 2024 EBITDA over 3x, which we view as the cutoff of sustainability in a 280e world. We view 4x as sustainable in a post-280e environment, and five companies are now over that threshold.
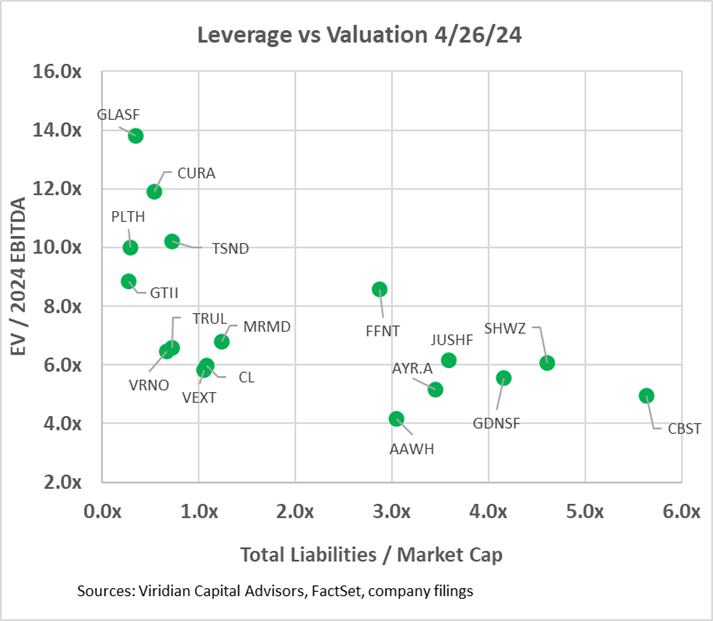
- The second graph looks at leverage through the lens of total liabilities to market cap. This measure separates the companies into three groups:
- On the bottom left are companies with low valuation multiples but also low market leverage. The group includes Verano, Trulieve, Cresco, MariMed, and Vext. With regard to Vext and MariMed, the consensus seems to be that both lack sufficient scale for the long run. Vext is small enough and geographically constrained enough to be a takeout candidate, while MariMed is priced attractively based on its fundamentals. However, it is geographically diversified enough to pose issues of overlap with potential acquirers. The other three show that the market is not yet willing to fully sign on to the Florida rec story.
- Meanwhile, in the bottom right are companies where the market has doubts about whether the company can discharge its liabilities without highly dilutive actions, like discounted stock sales or refinancing debt with a heavy warrant or share consideration.
- And in the top left, the darlings of the market. These companies have high valuation multiples but also low market leverage. They have excellent currency for acquisitions but could also stand more leverage if a great debt deal were to be possible. These companies may be candidates to buy cash flow through accretive acquisitions.
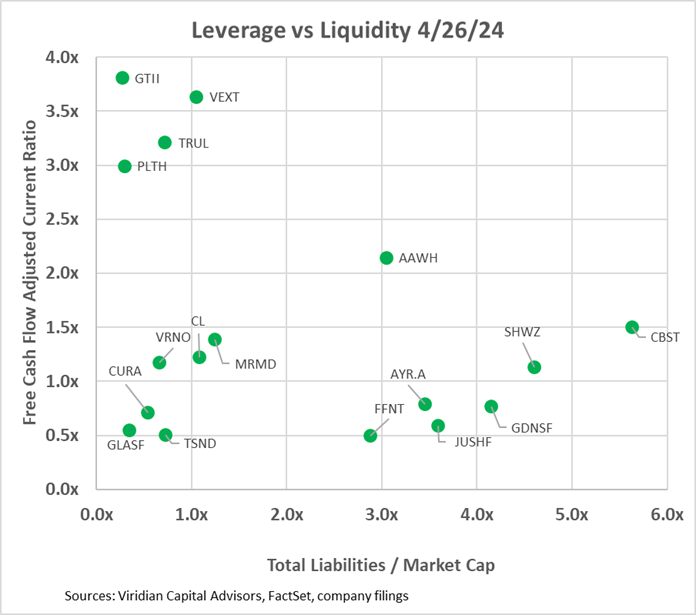
- The third graph introduces the free cash flow adjusted current ratio liquidity measure into the mix. Companies with less than 1x on this measure will likely have to raise capital next year. Surprisingly, seven of the companies fall into this bucket. Note the lower liquidity position of Trulieve and TerrAscend relative to last week’s graph. This graph also breaks the sector into three distinct groupings. The bottom left group has low leverage but also modest liquidity. Some of the companies, including Verano, MariMed, and Cresco, have sufficient but not comfortable levels of liquidity, while others, including Curaleaf, TerrAscend, and Glass House, are below the critical 1x liquidity line. Companies on the lower right generally have constrained liquidity and high leverage, a potentially dangerous combination in a capital-constrained environment. Several of these have high optionality, however. Jushi, for example, is highly influenced by developments in Virginia and Pennsylvania. 4Front’s finances are dependent on the success of its massive Illinois cultivation project. AYR’s success rides heavily on Florida. Each of these companies bears careful monitoring. We know what to look for, but guessing the outcomes is nearly impossible. Ascend is a particular case and shows up on the graph in a region of its own. It looks to have excellent liquidity; however, this disguises the material debt maturities facing the company in 2025, which is just beyond the purview of our liquidity ratio.
- Looking at leverage in two ways and having a comprehensive measure of liquidity can give investors a good idea of possible scenarios for today’s overleveraged companies.
- VALUATION, LEVERAGE, AND LIQUIDITY
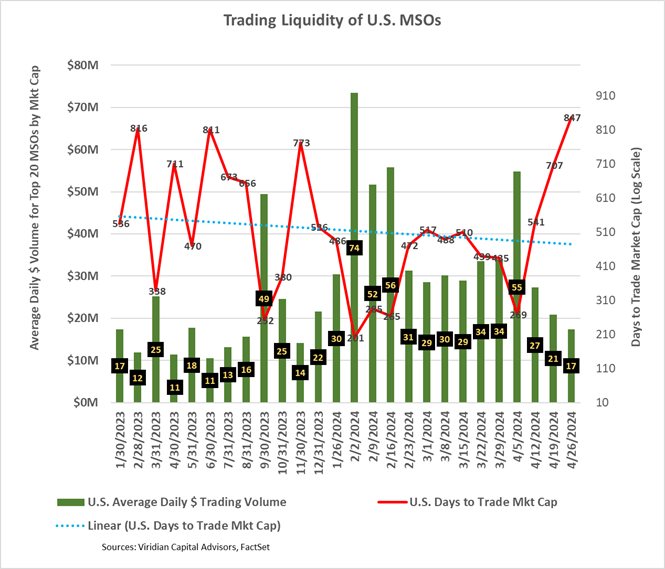
- CANNABIS STOCK LIQUIDITY DROPPED SHARPLY IN THE WEEK AFTER 4/20
- Cannabis stocks took a significant step backward in liquidity this week, with dollar trading volumes and Days To Trade Market Cap indicators returning to levels last seen before the HHS rescheduling announcement.
- The Days to Trade Market Cap (DTTMC) series depicts the number of days it would take to trade the market cap of a stock or group of stocks. Its most recent reading of 847 days is significantly above the downward trend line shown on the graph. An 847 DTTMC implies that an investor who acquired a 5% position in the stock, assuming he wanted to be less than 25% of the average daily dollar volume, would require 169 days to trade out of his position.
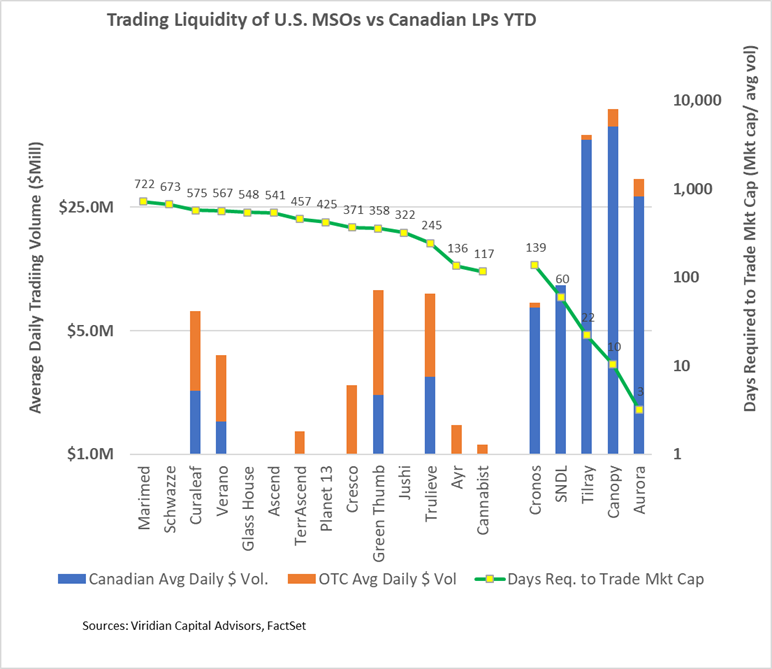
- Interestingly, several of the companies with the highest dollar trading volume, like Curaleaf, appear to be among the most illiquid when viewed through the DTTMC lens. The YTD graph suggests that the movements of Curaleaf and TerrAscend to the TSX have done little to amp up their liquidity.
-
-
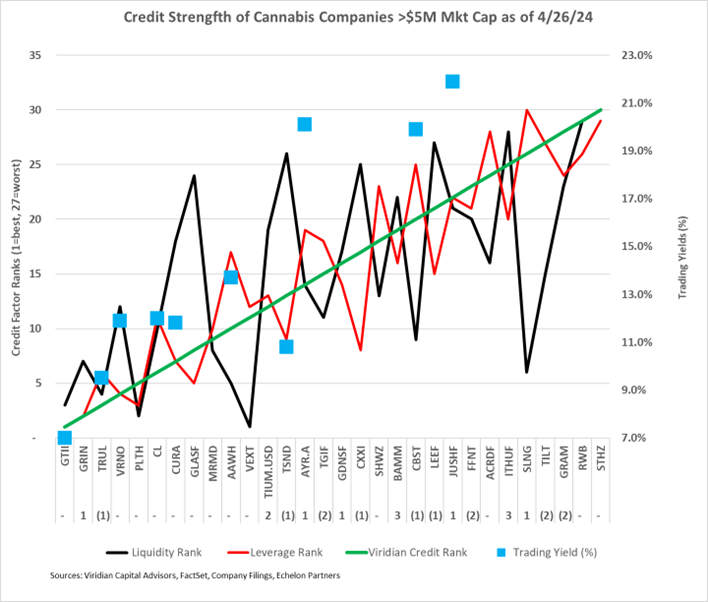
- GIVING CREDIT WHERE CREDIT IS DUE (to be revised in this week’s credit tracker for the impact of the DEA announcement)
- The chart below shows our updated 4/26/24 credit rankings for the 30 U.S. cannabis companies with over $5M market cap. The number below the ticker symbol indicates the change in credit ranking since last week, where a negative number suggests credit deterioration, while a positive indicates improvement.
- The blue squares show the offered-side trading yields for each company. Trading yields have declined significantly since the HHS rescheduling announcement.
- The spreads between GTI, Trulieve, and Curaleaf all widened this week.
- Curaleaf, Cresco, and Verano now trade at similar yields, and the premium to Trulieve is now starting to look too wide. Similarly, the two hundred basis points between Trulieve and GTI look too extreme, and GTI’s absolute yield level of 7% seems too tight relative to treasuries. We have no question that GTI is the best credit of the group but investors can now pick up nearly 400 basis points by trading into Verano paper.
- GIVING CREDIT WHERE CREDIT IS DUE (to be revised in this week’s credit tracker for the impact of the DEA announcement)
-

- Cannabis equities (as measured by the MSOS ETF) were up 0.23% for the week. The MSOS was up an additional 25% on Tuesday, April 30, following the news that the DEA would go along with schedule 3.
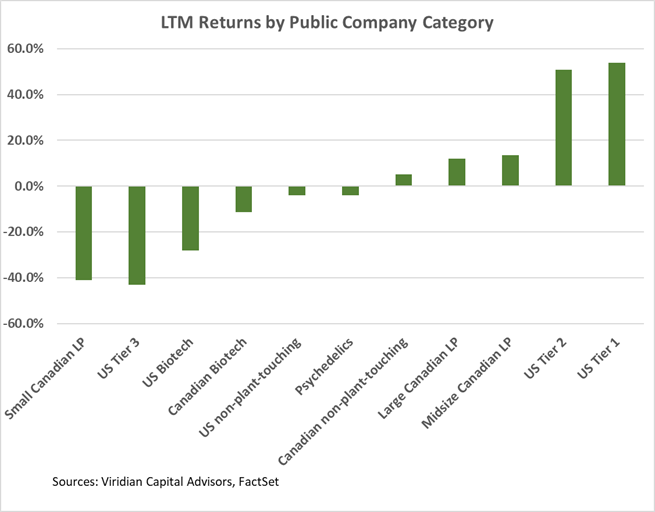
Trailing 52-Week Returns by Public Company Category:
- U.S. Tier One MSOs are now up over 60% for the LTM period, and Large Canadian L.P.s are now up around 17%. Canopy Growth is still down 36% for the period despite its 57% gain YTD.
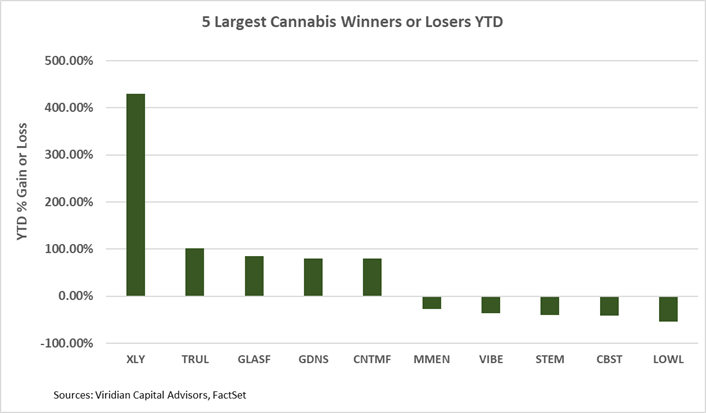
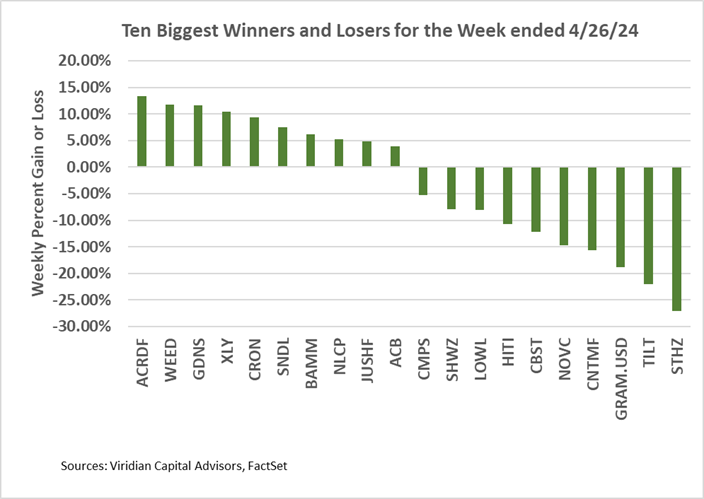
Best and Worst Performers of the last week and YTD:
- Acreage and Canopy Growth are at the top of the leader’s list following the shareholder approval of Canopy’s U.S. strategy.
- Tilt and Gold Flora were among the biggest losers this week, a fact that partially drove the deterioration of their relative credit rankings.