OUR 9TH YEAR OF PROVIDING PROPRIETARY CAPITAL MARKETS INTELLIGENCE ON THE CANNABIS / HEMP / PSYCHEDELIC SECTORS
Each week, Viridian publishes insights and analysis on completed capital raise transactions in the prior week, focusing on all equity and debt deals. Our analysis includes:
- Summary
- Outlook
- Best & Worst Perfromers
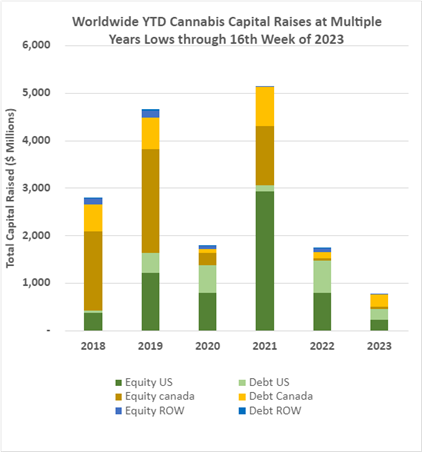
- Cannabis capital raises are off to a multi-year low. Only $776.95M closed through the first sixteen weeks of the year compared to $1,725.49M last year.
- Debt represents 62.6% of total capital raised, higher than in any other comparable period back to 2018.
- Public companies have raised only 61.3% of total capital YTD, down from 81.4% last year.
VIRIDIAN INSIGHTS
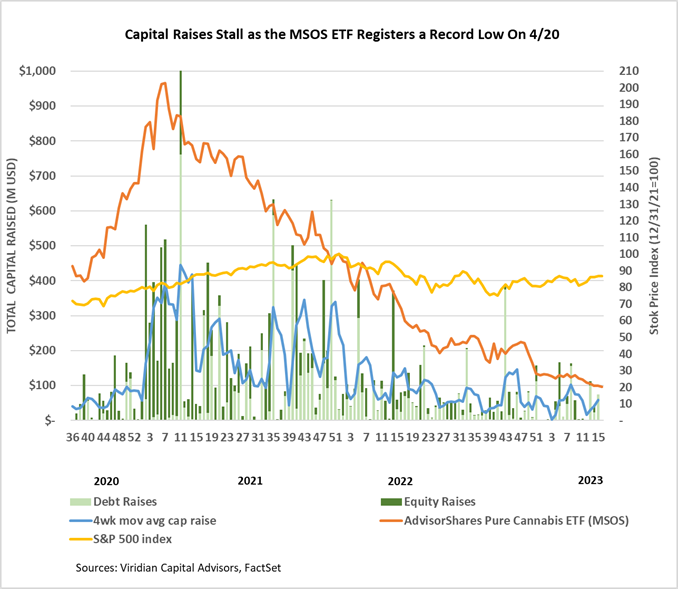
- Most industry participants believe that cannabis pricing is irrationally low relative to the industry’s growth potential. It seemed like an insult added to injury that the MSOS ETF could close at its all-time low on the number one weed holiday, 4/20. As investors, we are constantly reminded of the quote from Keynes, “The markets can stay irrational longer than you can stay solvent.”
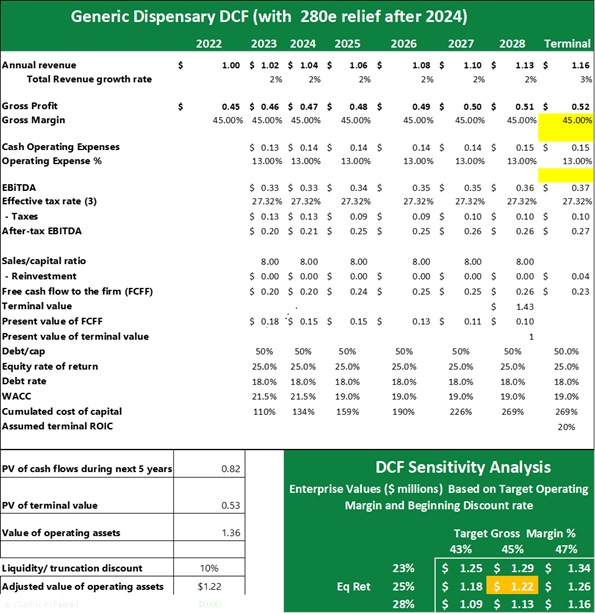
- We wanted to take a rational theoretical view of a prototypical cannabis asset, the leased dispensary. The following table shows a generic dispensary’s discounted cash flow valuation fully operating in a steady state mode. We are not tackling the thorny question of valuing a start-up, pre-revenue dispensary, nor are we solving for the value of a dispensary in a med state about to turn rec. We are taking the “easy” case of a dispensary operating at a relatively constant run rate in an established rec state. We assume that risk-averse investors demand 25% equity returns and 18% debt returns. We assume 280e will disappear in 2025, reducing the tax burden and after-tax WACC.
- We assume a 10% “truncation discount,” which accounts for the fact that all DCF analysis implicitly assumes a perpetual enterprise, an assumption open to doubt.
- We conclude that the generic dispensary is worth around 1.2x revenues or around 4.1x EBITDA under these margin, growth, and capital cost assumptions. We believe we have been extremely conservative with our assumptions. Locations with limited competition or other factors like significant scale economies may be significantly more valuable.
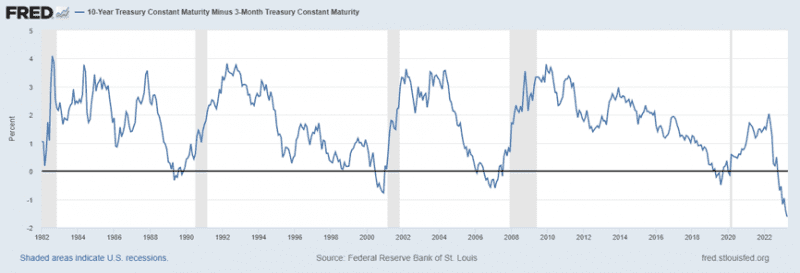
- The 10-year minus 3-month yield spread continues to be more inverted than it’s been for 20 years, yet we still believe that the Fed will continue raising rates. The Fed has aspirations beyond taming the inflation rate. Its fundamental goal is to tame the all-asset price bubble produced by a decade of zero interest rates. To achieve that goal, the Fed is not only not afraid of a recession but practically requires one. Its problem is that its political cover of taming inflation will likely give out before achieving its goal. Things will become interesting when that happens, particularly in an election year.
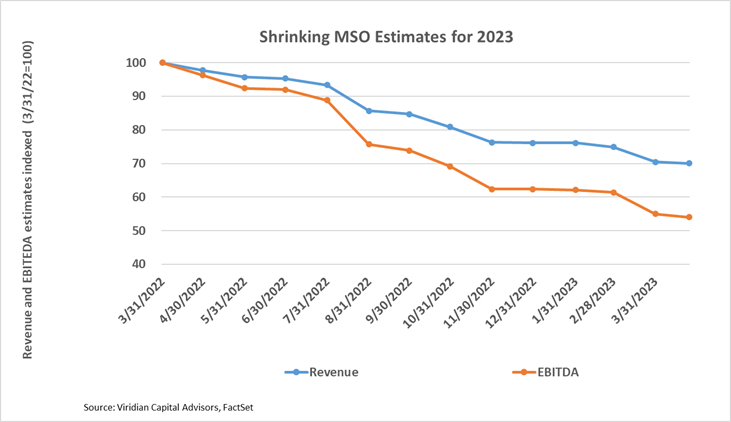
- The graph below shows the reduction in consensus 2023 revenue and EBITDA estimates for the top 15 MSOs over the last twelve months. 2023 EBITDA estimates are about 55% of what they were a year ago. The widening gap between the revenue and EBITDA lines shows the negative margin impact of wholesale price pressures matched with inflationary cost increases. As we near the release of Q1 earnings, our primary attention will be on these revisions and, hopefully, a flattening of this curve.
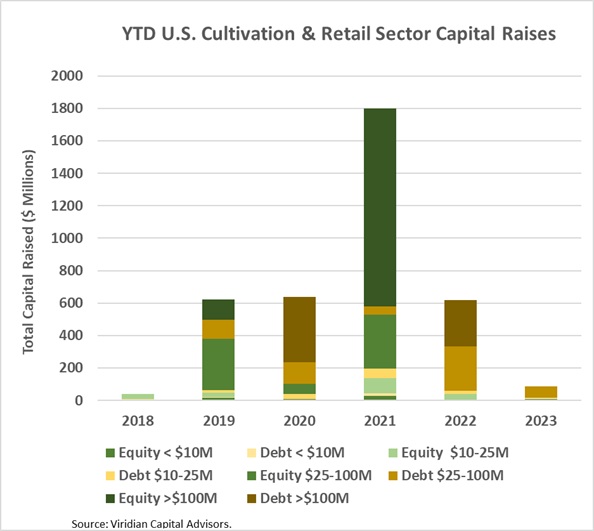
- YTD, U.S. Cultivation & Retail sector capital raises are down 86.2% from 2022.
- Debt is still the only game in town, accounting for 89.4% of all cultivation sector capital raised. All of the debt raised YTD has been for public companies.
- Large transactions are still absent from the market. There have been no debt or equity deals over $100M YTD.
- Cannabis equities (as measured by the MSOS ETF) were down 3.2% for the week, and the ETF ominously closed at an all-time low on 4/20. News that Senator Schumer plans to refile his comprehensive cannabis legislation produced little more than a chuckle and yawn.
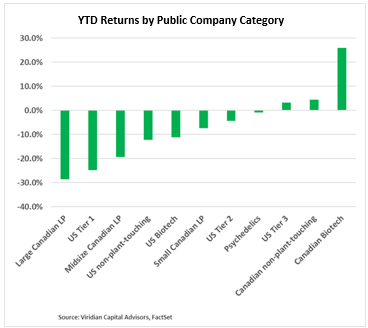
YTD Returns by Public Company Category
- Tier one and Tier two U.S. MSOs have negative YTD returns, while Tier three is hanging on to a slim 3% YTD gain. Eight of our eleven categories are now showing YTD losses. FSD Pharma (HUGE: Nasdaq) accounts for more than half of the gain of the Canadian Biotech category.
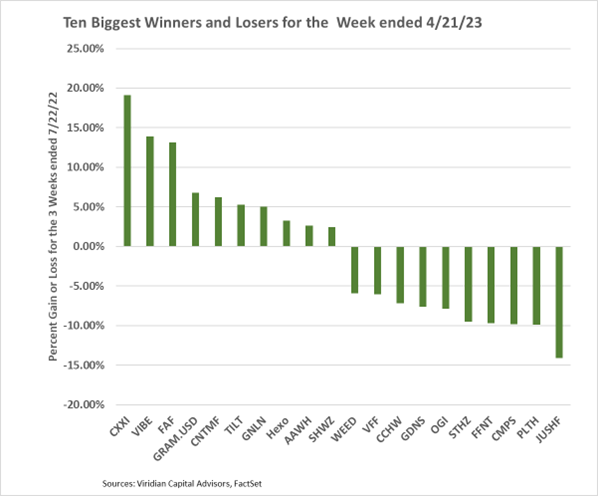
Best and Worst Performers of the last week and YTD
- The graph below shows the relative performance of the top five and bottom five performing U.S. Cannabis companies with more than a $20M market cap from the beginning of 2023. Twelve of the twenty-seven companies on the list have positive stock performance YTD.