OUR 9TH YEAR OF PROVIDING PROPRIETARY CAPITAL MARKETS INTELLIGENCE ON THE CANNABIS / HEMP / PSYCHEDELIC SECTORS
Each week, Viridian publishes insights and analysis on completed capital raise transactions in the prior week, focusing on all equity and debt deals. Our analysis includes:
- Summary
- Outlook
- Best & Worst Perfromers
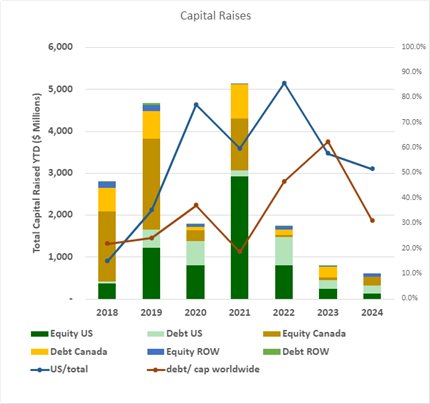
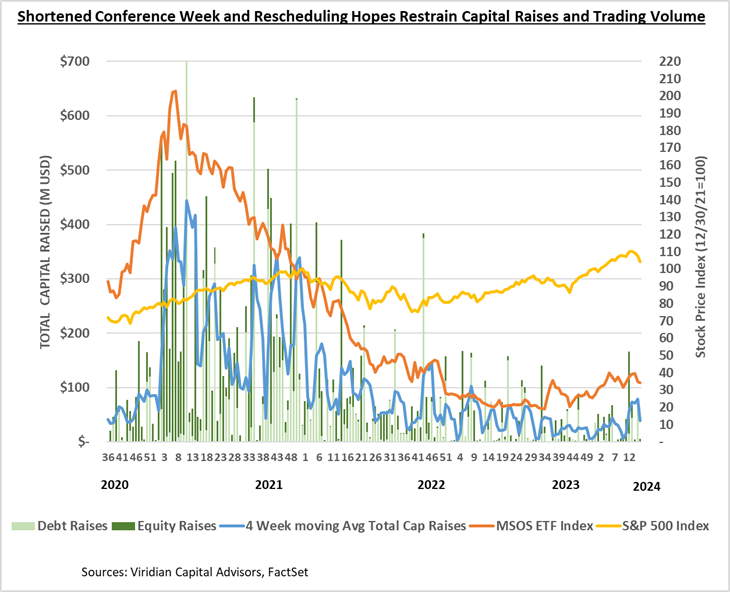
- The U.S. raises accounted for 51.8% of total funds, the lowest percentage since 2019. Conversely, raises from outside the U.S. and Canada, spurred by a sizeable psychedelic equity raise in the U.K., represented a historically high 12.6% of the total funds raised.
- YTD raises by public companies accounted for 68.4% of total funds.
VIRIDIAN INSIGHTS
- VIRIDIAN INSIGHTS
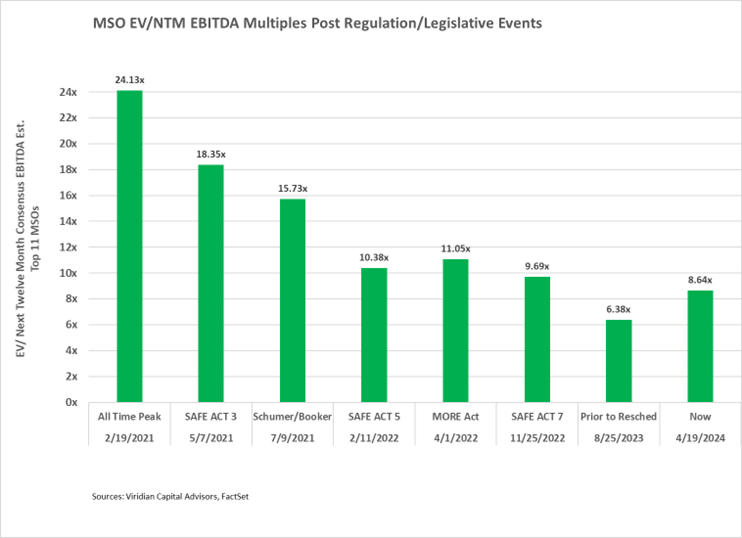
- STILL UNDERVALUED, BUT NOT NEARLY AS MUCH AS TWO YEARS AGO.
- The Viridian Chart of the Week had one surprisingly controversial conclusion: Adjusted for the punitive taxation of 280e, cannabis would look consistently valued with the rest of the industries we profiled. The difference between its 8.24x multiple and the 13.7x multiple predicted by our regression line on the chart is almost entirely explained by 280e. Make no mistake, though, if S3 were announced tomorrow, we don’t think it would be long before the aggregate multiples blew right past that 13.7x! We could easily see multiples exceeding the 15.73x mark they hit on 7/9/21 after the unveiling of the Schumer/Booker plan. We also continue to believe that analysts are underestimating revenue growth, particularly in 2025, when Florida and Pennsylvania may come into play.
- STILL UNDERVALUED, BUT NOT NEARLY AS MUCH AS TWO YEARS AGO.
- MUST BE THOSE PREROLLS!
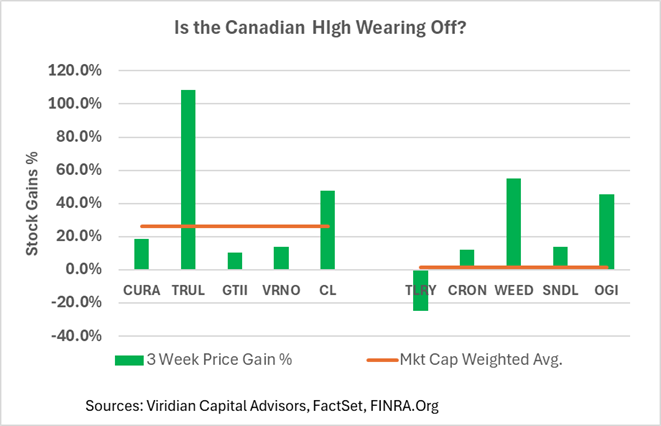
- The chart below shows the YTD percentage gain in the top five U.S. MSOs versus the top five Canadian L.P.s.
- Two weeks ago, this chart looked dramatically different. The Canadian L.P.s were soaring to levels that frankly made us believe the Canadian L.P. investors were smoking too much of the product.
- The average returns of 26.4% for the MSOs vs 1.3% for the L.P.s is highly deceptive. If we take out the two apparent outliers, Trulieve on the upside and Tilray on the downside, we get a totally different picture: MSOs are up 16.79%, and L.P.s are up 25.97%.
- So irrationality prevails.
- We have discussed in prior weeks the likely reasons for this: the opening of Germany, the report recommending changes in Canadian regulation, and the perception that the U.S. may be opened soon.
- We are unconvinced. And sorry if we can’t justify Canopy being up 55% YTD. It just does not compute. Maybe it has to go back to the old saw, “These stocks are for trading, not investment.”
-
- VALUATION, LEVERAGE, AND LIQUIDITY
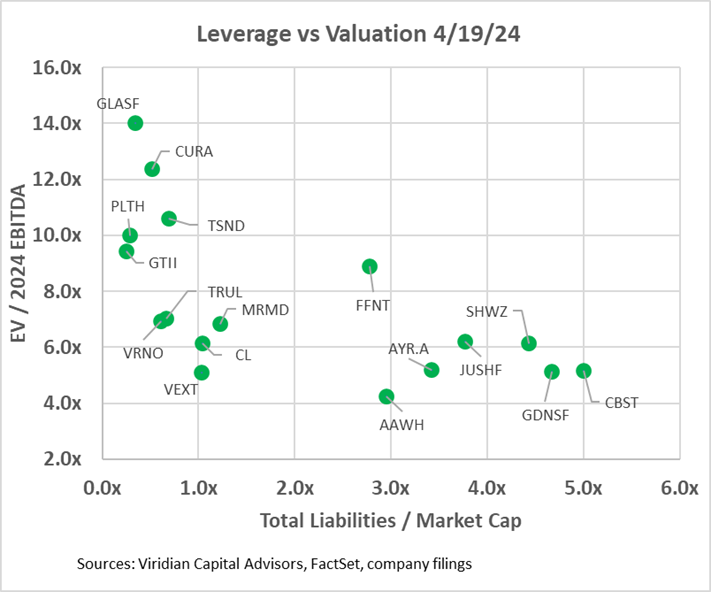
- The two graphs below show the Enterprise value to 2024 EBITDA multiples against two leverage measures. In the first graph, we have calculated an Adjusted Net Debt/ 2024 EBITDA figure by adding any accrued taxes over 90 days of tax expense to debt before subtracting cash to arrive at Adjusted Net Debt. We would expect any regular company to have accrued taxes equal to their last quarterly tax expense and consider that a standard working capital item. Several companies on the chart have far greater than 90 days of accrued taxes, and we consider the excess to be debt. Verano’s excess tax liabilities equal nearly 40% of its debt. Other companies with relatively high imputed tax debt include Curaleaf (CURA: CSE) and 4Front (FFNT: CSE) at 19%, and Terrascend (TSND: TSX) at 17%.
- The first graph shows that ten of the seventeen companies have net debt/ 2024 EBITDA over 3x, which we view as the cutoff of sustainability in a 280e world. We view 4x as sustainable in a post-280e environment, and five companies are now over that threshold.
- The second graph looks at leverage through the lens of total liabilities to market cap. This measure separates the companies into three groups:
- On the bottom left are companies with low valuation multiples but also low market leverage. The group includes Verano, Trulieve, Cresco, MariMed, and Vext. With regard to Vext and MariMed, the consensus seems to be that both lack sufficient scale for the long run. Vext is small enough and geographically constrained enough to be a takeout candidate, while MariMed is priced attractively based on its fundamentals. However, it is geographically diversified enough to pose issues of overlap with potential acquirers. The other three show that the market is not yet willing to believe the Florida story.
- Meanwhile, in the bottom right are companies where the market has doubts about whether the company can discharge its liabilities through highly dilutive actions, like discounted stock sales or refinancing debt with a heavy warrant or share consideration.
- And in the top left, the darlings of the market. These companies have high valuation multiples but also low market leverage. They have excellent currency for acquisitions but could also stand more leverage if a great debt deal were to be possible. These companies may be candidates to buy cash flow through accretive acquisitions.
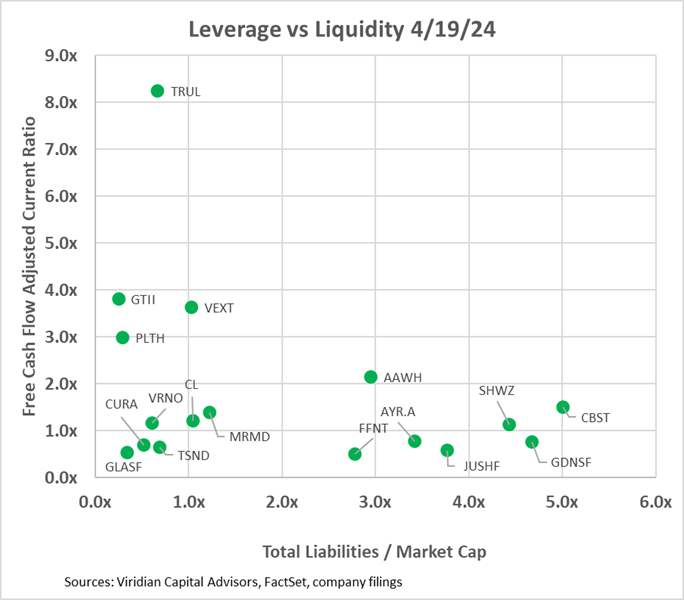
- The third graph introduces the free cash flow adjusted current ratio liquidity measure into the mix. Companies with less than 1x on this measure will likely have to raise capital next year. Surprisingly, seven of the companies fall into this bucket. This may not be much of an issue if you are on the lower left of the graph, like Curaleaf or TerrAscend. They are performing well enough to roll their debt or obtain new credit to bridge any gaps. 4Front, Jushi, and AYR are in less desirable positions on the bottom right. With tight liquidity and high leverage, it’s a game of optionality. For Jushi, it’s Pennsylvania and Virginia. For AYR, it’s Florida. And, for 4Front, it’s making its big Illinois bet pay off. All three would, of course, be significant beneficiaries of S3. Jushi and AYR have shelf registrations that make them ready to jump on opportunities.
- Looking at leverage in two ways and having a comprehensive measure of liquidity can give investors a good idea of possible scenarios for today’s overleveraged companies.
- VALUATION, LEVERAGE, AND LIQUIDITY

-
-
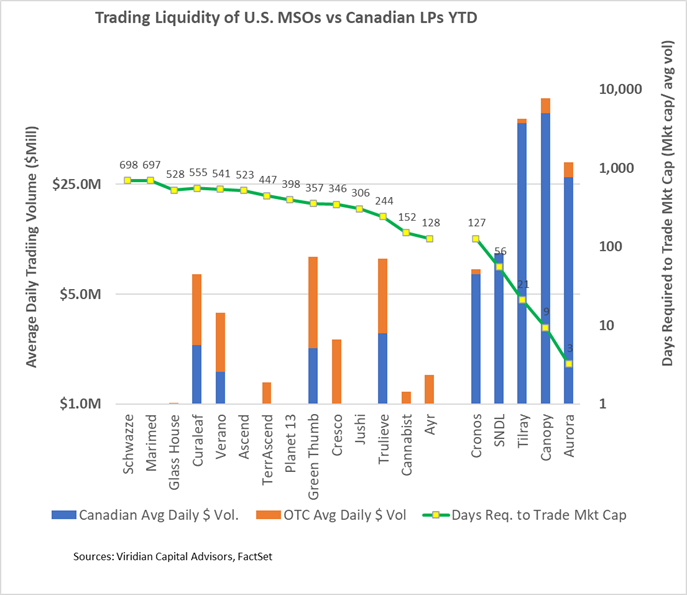
- CANNABIS STOCK LIQUIDITY DETERIORATES FURTHER IN THE WEEK BEFORE 420
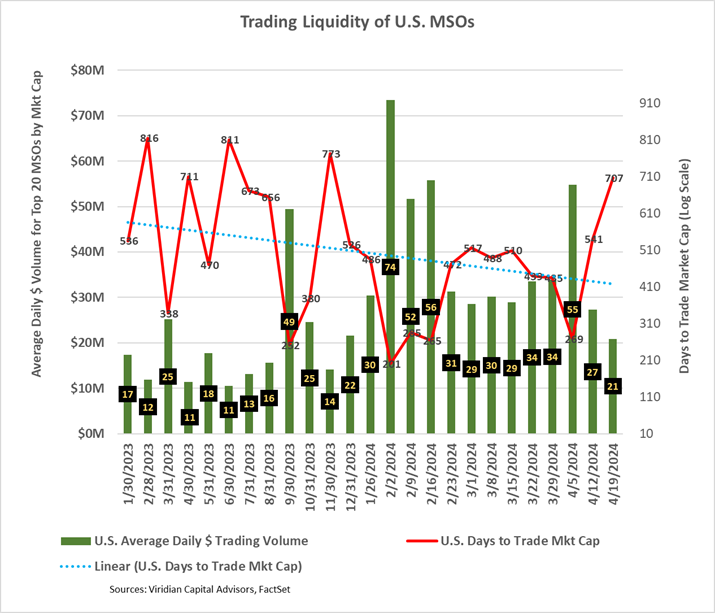
- Cannabis stocks took a significant step backward in liquidity this week, with dollar trading volumes and Days To Trade Market Cap indicators returning to levels last seen in November.
- The Days to Trade Market Cap (DTTMC) series depicts the number of days it would take to trade the market cap of a stock or group of stocks. Its most recent reading of 707 days is above the downward trend line shown on the graph. A 707 DTTMC implies that an investor who acquired a 5% position in the stock, assuming he wanted to be less than 25% of the average daily dollar volume, would require 141 days to trade out of his position.
- Interestingly, several of the companies with the highest dollar trading volume, like Curaleaf, appear to be among the most illiquid when viewed through the DTTMC lens.
- CANNABIS STOCK LIQUIDITY DETERIORATES FURTHER IN THE WEEK BEFORE 420
-
-
-
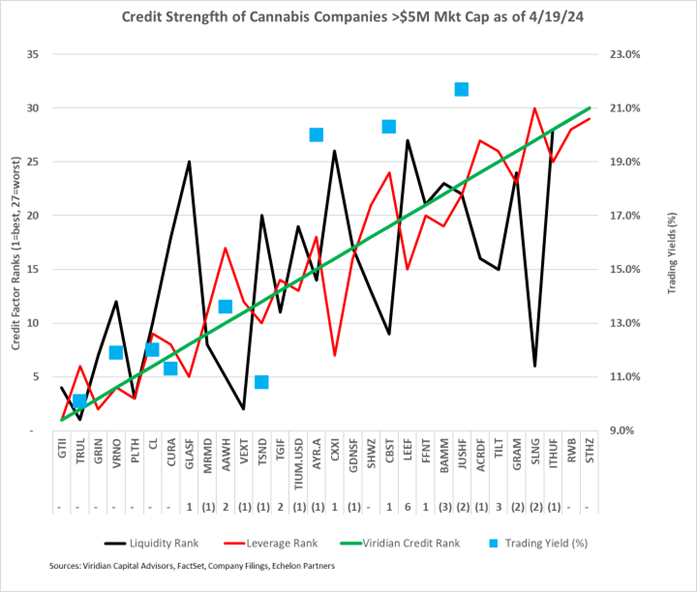
- GIVING CREDIT WHERE CREDIT IS DUE
- The chart below shows our updated 4/19/24 credit rankings for the 30 U.S. cannabis companies with over $5M market cap. The number below the ticker symbol indicates the change in credit ranking since last week, where a negative number suggests credit deterioration, while a positive indicates improvement.
- The blue squares show the offered-side trading yields for each company. Trading yields have declined significantly since the HHS rescheduling announcement.
- The rankings spread between Trulieve and Curaleaf appropriately widened this week.
- Based on this week’s rankings, Curaleaf debt now looks fairly priced, trading at a reasonable spread to GTI and Trulieve, which we believe are superior credits. Trulieve should trade at a bit wider spread to GTI. Cresco’s senior secured term debt continues to appear too cheap, so trading out of Curaleaf into Cresco seems like a good trade. Jushi’s debt has traded off, appropriately given the governor’s veto of adult rec in Virginia. AYR has significantly more leverage to a Florida rec event, and we believe it should trade at a lower yield relative to Cannabist.
- Jushi trades at a higher yield than comparable credits because the debt is 2nd lien rather than the first lien.
- GIVING CREDIT WHERE CREDIT IS DUE
-
- Cannabis equities (as measured by the MSOS ETF) were down 1.79% for the week.
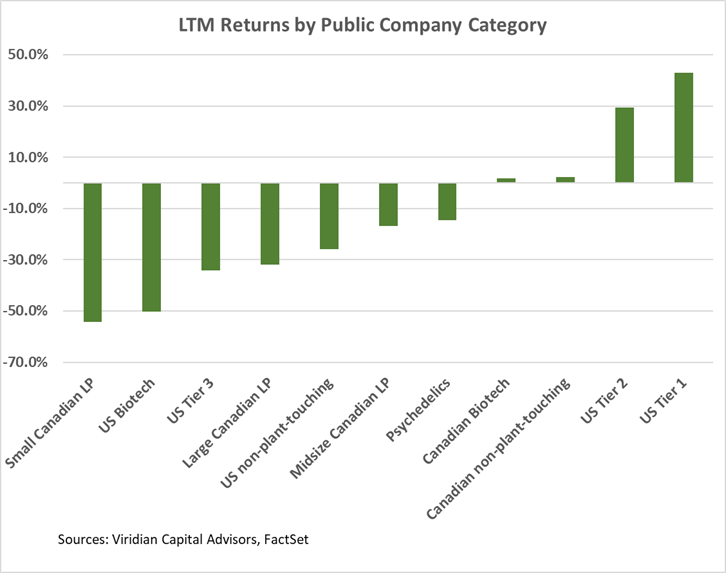
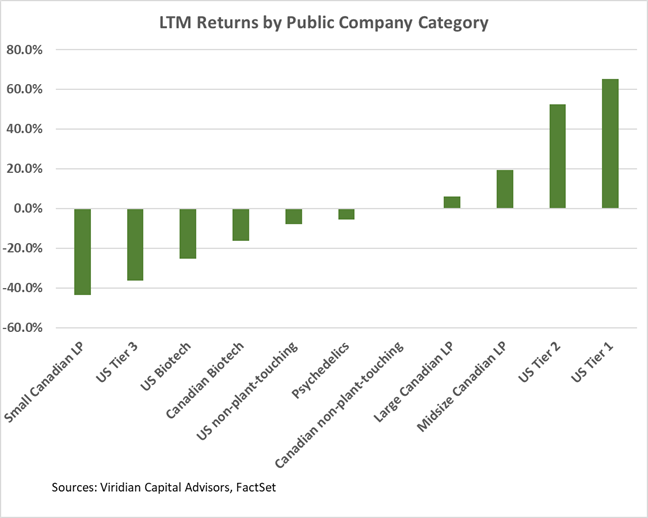
Trailing 52-Week Returns by Public Company Category:
- U.S. Tier One MSOs are now up over 60% for the LTM period, and Large Canadian L.P.s are now up around 17%. Canopy Growth is still down 36% for the period despite its 57% gain YTD.
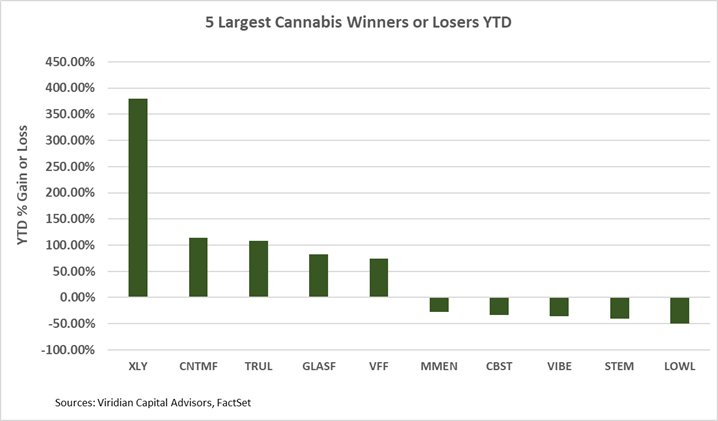
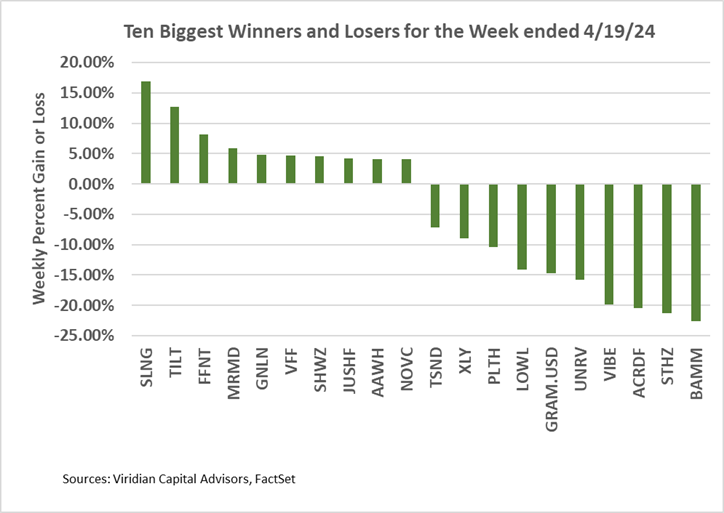
Best and Worst Performers of the last week and YTD:
- The YTD gainers list has changed very little since last week, with Auxly holding on to the gains we have been skeptical about and Florida levered Trulieve and Cansortium holding onto the #2 and 3 spots.
- The biggest winners and losers list speaks primarily to remarkable volatility. StateHouse, Body & Mind, Acreage, and Planet 13 are among the ten worst performers this week after being in the top ten last week. For companies on the lowest end of our credit rankings, the stocks trade like out-of-the-money options, responding principally to changes in volatility.