OUR 9TH YEAR OF PROVIDING PROPRIETARY CAPITAL MARKETS INTELLIGENCE ON THE CANNABIS / HEMP / PSYCHEDELIC SECTORS
Each week, Viridian publishes insights and analysis on completed capital raise transactions in the prior week, focusing on all equity and debt deals. Our analysis includes:
- Summary
- Outlook
- Best & Worst Perfromers
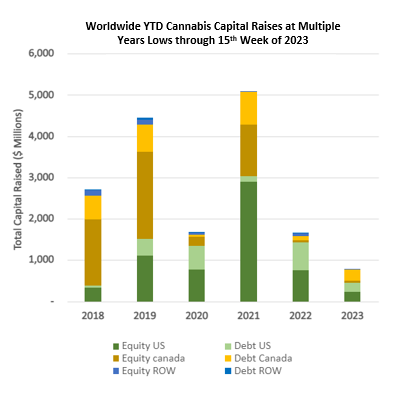
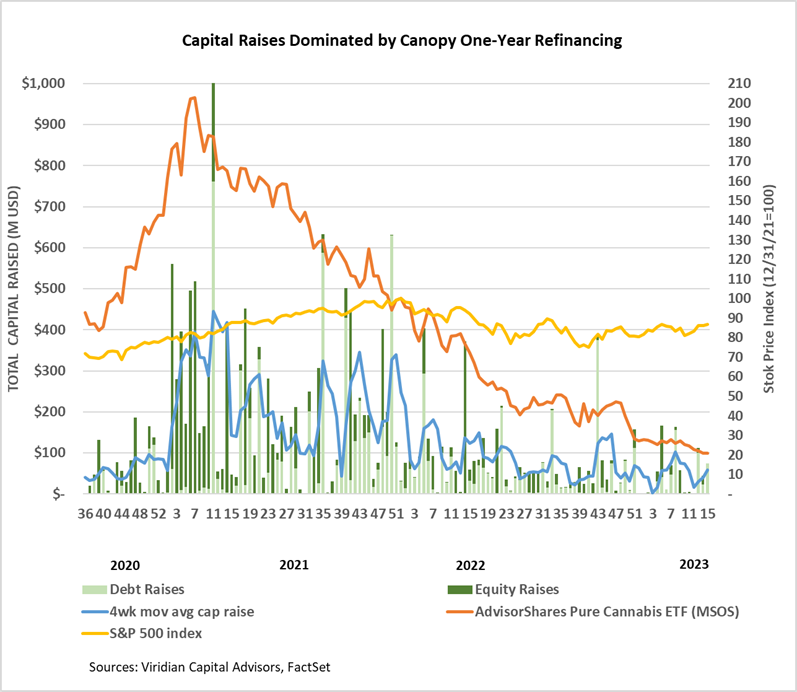
- Cannabis capital raises are off to a multi-year low. Only $776.96M closed through the first fifteen weeks of the year compared to $1,644.84M last year.
- Debt represents 62.6% of total capital raised, higher than in any other comparable period back to 2018.
- Public companies have raised only 61.3% of total capital YTD, down from 81.4% last year.
VIRIDIAN INSIGHTS
- The Curaleaf vs. New Jersey regulators drama of the last week demonstrates the capricious nature of state regulation and the sensitivity of even the largest MSO to the performance of a single market. On April 13, the New Jersey Cannabis Regulatory Commission’s voted to deny the renewal of Curaleafs adult-use licenses. The decision potentially affected two cultivation facilities and two stores, including the Bellmayr dispensary, one of the country’s most profitable stores with estimated annual sales of over $80M. The commission objected to Curaleaf’s decision to close a cultivation facility in Bellmayr and was bothered by allegations that the company interfered with attempts to unionize the facility. Curaleaf’s stock dropped approximately 10% in the two days following the decision, erasing $185M of market value. To put the potential loss in perspective, the Bellmayr dispensary accounts for over 6% of Curaleaf’s total 2022 revenue. Only 19 public cannabis companies have as much total revenue as that store. Luckily for Curaleaf, skillful persuasion, no doubt emphasizing the lost tax revenue and employment that the state would experience, saved the day, and the commission reversed the decision. Curaleaf’s stock bounced back by 7%. A kick-save and a good one! But a painful lesson was learned: regulators do not always act in the rational economic interest of the state. I guess New York should have taught us that one!
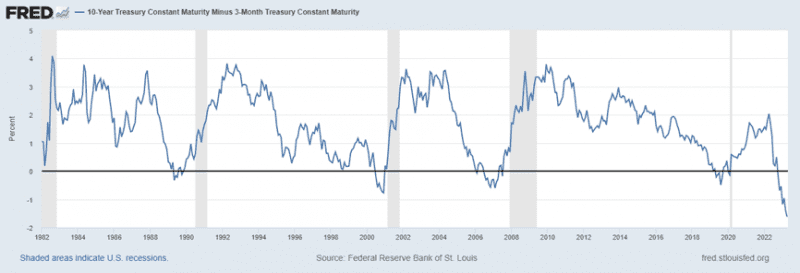
- The 10-year minus 3-month yield spread at -1.61 points continues to be more inverted than it’s been for 20 years, yet we still believe that the Fed will continue raising rates. The Fed has aspirations beyond taming the inflation rate. Its fundamental goal is to tame the all-asset price bubble produced by a decade of zero interest rates. To achieve that goal, the Fed is not only not afraid of a recession but practically requires one. Its problem is that its political cover of taming inflation is likely to give out before achieving its goal. Things will become interesting when that happens, particularly in an election year.
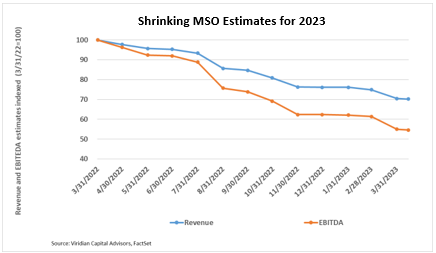
- Hopefully, we are nearing an inflection point where analyst estimates of year-ahead EBITDA begin to bottom out. We do not believe a substantial stock resurgence will occur until expectations stabilize. The graph below shows the reduction in consensus 2023 revenue and EBITDA estimates for the top 15 MSOs over the last twelve months. 2023 EBITDA estimates are about 55% of what they were a year ago. The widening gap between the revenue and EBITDA lines shows the negative margin impact of wholesale price pressures matched with inflationary cost increases.
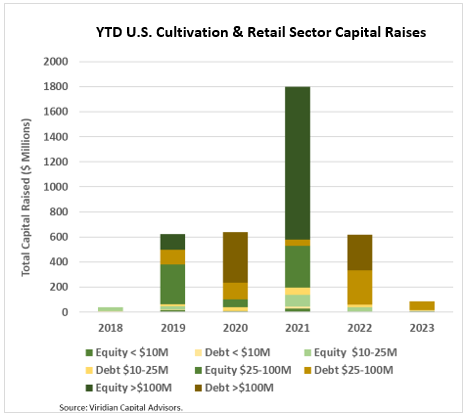
- YTD, U.S. Cultivation & Retail sector capital raises are down 86.2% from 2022.
- Debt is still the only game in town, accounting for 89.4% of all cultivation sector capital raised. All of the debt raised YTD has been for public companies.
- Large transactions are still absent from the market. There have been no debt or equity deals over $100M YTD.
- Cannabis equities (as measured by the MSOS ETF) were down 0.56% for the week, and most of the companies we track are trading near their 52-week lows.
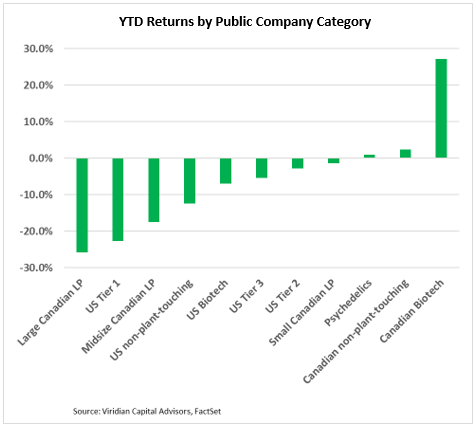
YTD Returns by Public Company Category
- All three tiers of U.S. MSOs now have negative YTD returns, and the large Canadian L.P.s and Tier One U.S. MSOs are the two worst-performing categories. Eight of our eleven categories are now showing YTD losses. The Canadian Biotech category is up 27% YTD, primarily due to the 135% gains in FSD Pharma Inc. (HUGE: Nasdaq). FSD has had several positive news developments in 2023, including the January formation of a partnership with ATAI Life Sciences to focus on psilocybin-based treatments for depression and the February successful completion of Phase 2 clinical trials of a new psilocybin-based therapy for depression. The company’s other businesses include two lead products for treating inflammatory diseases.
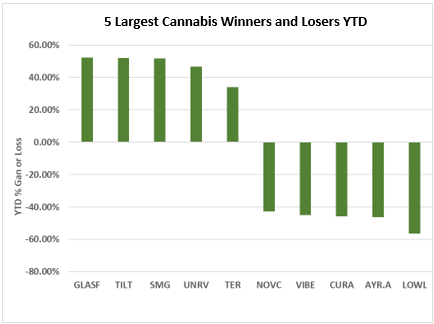
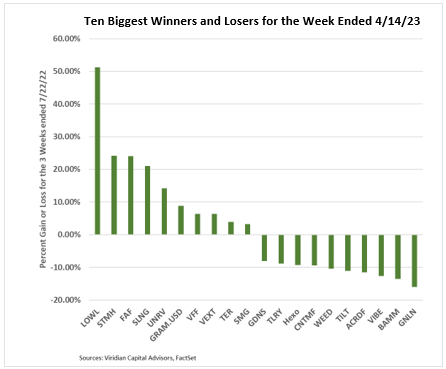
Best and Worst Performers of the last week and YTD
- The top three and bottom three performers YTD have not changed since last week.
- Acreage Holdings (ACRDF: OTC) appeared on the ten largest loser list this week as it has been over three weeks since the company announced a delay in releasing its 4th quarter and full year 2022 earnings.
- Fire & Flower Holdings (FAF: TSX) was up approximately 24% for the week on news that it had signed a new master licensing agreement with Couche-Tard Inc. demonstrating strong commitment from the $51B market cap retail giant.