OUR 9TH YEAR OF PROVIDING PROPRIETARY CAPITAL MARKETS INTELLIGENCE ON THE CANNABIS / HEMP / PSYCHEDELIC SECTORS
Each week, Viridian publishes insights and analysis on completed capital raise transactions in the prior week, focusing on all equity and debt deals. Our analysis includes:
- Summary
- Outlook
- Best & Worst Perfromers
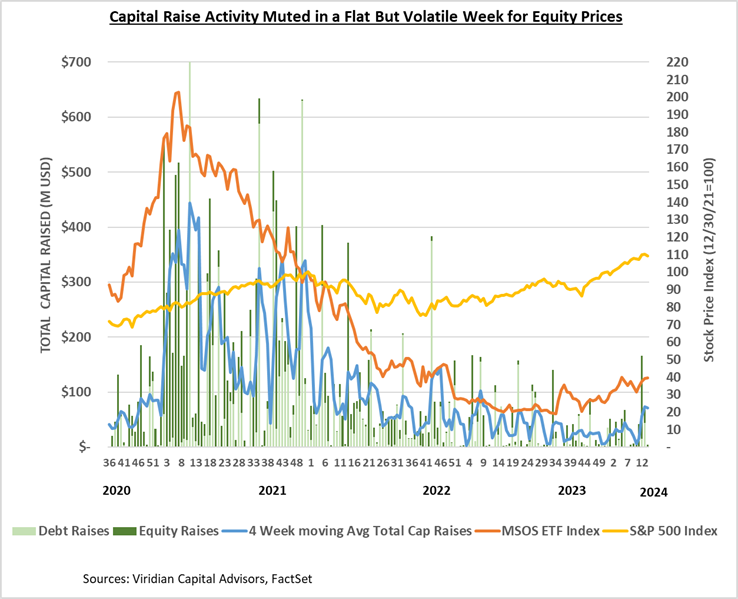
- The US raises accounted for 45.4% of total funds, the lowest percentage since 2019. Conversely, raises from outside the US and Canada, spurred by a sizeable psychedelic equity raise in the UK, represented a historically high 14.3% of the total funds raised.
- YTD raises by public companies accounted for 76.9% of total funds.

VIRIDIAN INSIGHTS
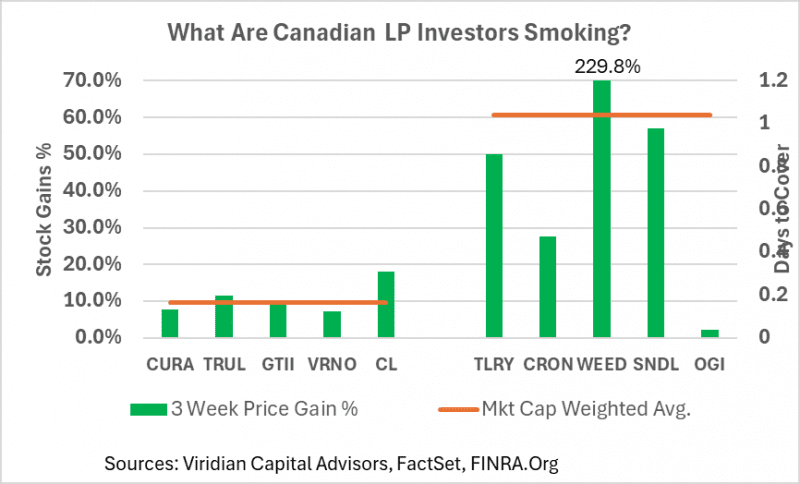
- AN IRRATIONAL RALLY IN CANADIAN LP STOCKS?
- The chart below now shows the three-week percentage gain in the top five U.S. MSOs versus the top five Canadian LPs.
- We went through the litany of potential causes for the difference last week, including increased hopes for US legalization (low odds in the next five years, in our opinion), the results of the new report on cannabis laws in Canada (mild impact but largely disappointing), the legalization in Germany (a potential long term positive, however, the current form of the law is lacking on commercialization provisions, and the positive impacts are likely to, at best, take longer to play out than the headlines suggest). Conclusion positive but not spectacularly so)
- This week’s additional dose of positivity comes from new progress towards medical cannabis in France.
- So, we stick to our original conclusion: Canadian cannabis investors have been whittling away at the excess inventories of cannabis.
- The 178% two-week gain in Canopy Growth implies more of a use of psychedelics than cannabis. We learned that you can’t keep a good meme stock down, but is there a better short candidate than this?
- Florida’s Supreme Court Approved a ballot measure for a change to the State’s Constitution, which would allow for adult recreational use of cannabis.
- The measure must pass by a 60% supermajority to become effective, and various polls have it quite close. Ohio’s adult rec bill passed with a 57% approval rate. Ohio also benefitted from the presence of an abortion bill on the ballot, which is thought to have increased voter participation. The Florida Court also approved an initiative to let voters decide to amend the State’s Constitution to establish a right to an abortion.
- The Viridian Chart of the Week explored the potential impacts on companies levered to Florida and found that an adult recreational move could double several stocks.
- The potential for an adult market in Florida is BIG! Industry rules of thumb generally call for a doubling of cannabis sales in a state that goes rec. But is this reasonable for Florida? The table below provides some key data points for analyzing the question.

-
-
- Florida’s sales per adult population are already in the middle of some established adult markets. Some observers believe Florida will more than double, perhaps as much as triple, if adult rec is approved.
- Support for more than doubling comes from looking at Colorado, which has 2.09x the spending per adult population. Could Florida go higher than that?
- One factor is tourism, which Florida and Colorado both gain from. Florida has the edge there.
- Another factor is demographics. Florida is older and more affluent than Colorado, which are both positive factors.
- Still, another factor is availability. The chart shows dispensaries per 100,000 adult population. Florida, at 3.67, is above some of the adult states but nowhere near Colorado. Edge goes to Colorado on that basis.
- Still another positive fact: Florida is one of the states that have recently cracked down on intoxicating hemp products, and that should be positive for adult recreational use.
- Conclusion: there is sufficient evidence to support the industry rule of thumb of a doubling; however, the claims that the state could triple or quadruple are highly speculative, and Viridian believes largely unsupported by the data.
- Even at a doubling, the Florida increase would by itself represent about 7% of 2024 cannabis sales. The measure would not go into effect until mid-2025 but would add significantly to industry growth.
-
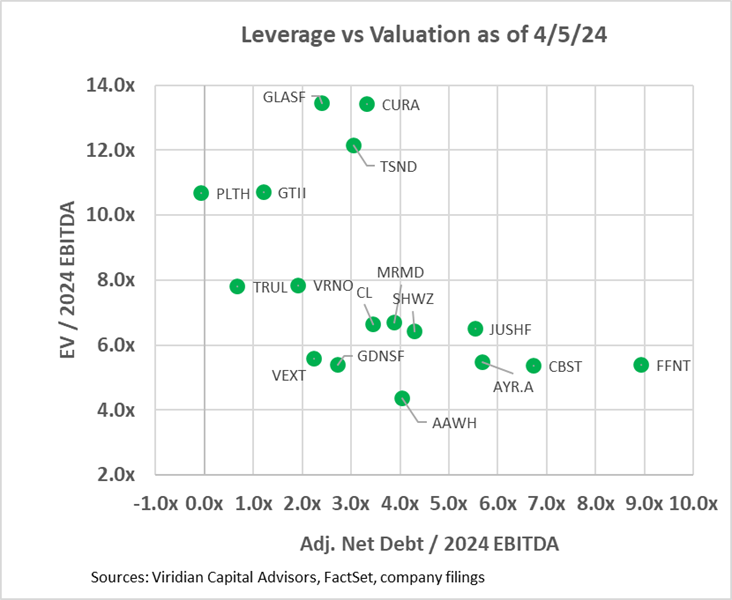
- VALUATION, LEVERAGE, AND LIQUIDITY
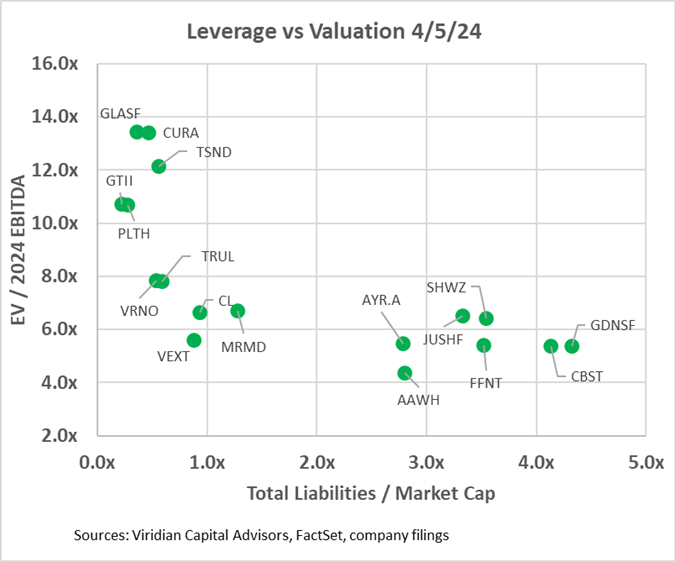
- The two graphs below show the Enterprise value to 2024 EBITDA multiples against two leverage measures. In the first graph, we have calculated an Adjusted Net Debt/ 2024 EBITDA figure by adding any accrued taxes over 90 days of tax expense to debt before subtracting cash to arrive at Adjusted Net Debt. We would expect any regular company to have accrued taxes equal to their last quarterly tax expense and consider that a standard working capital item. Several companies on the chart have far greater than 90 days of accrued taxes, and we consider the excess to be debt. Verano’s excess tax liabilities equal nearly 40% of its debt. Other companies with relatively high imputed tax debt include Curaleaf (CURA: CSE) and 4Front (FFNT: CSE) at 19%, and Terrascend (TSND: TSX) at 17%.
- The first graph shows that ten of the seventeen companies have net debt/ 2024 EBITDA over 3x, which we view as the cutoff of sustainability in a 280e world. We view 4x as sustainable in a post-280e environment, and five companies are now over that threshold.
- The second graph looks at leverage through the lens of total liabilities to market cap. This measure separates the companies into two groups that relate to the market’s belief of whether a company can discharge its liabilities without highly dilutive actions, like discounted stock sales or refinancing debt with a heavy warrant or share consideration.
- Companies that have too much debt but have low liabilities to market cap are candidates for stock sales or debt for equity exchanges. These companies include Cresco and TerrAscend. Alternatively, these companies may delever by using their high valuation to buy cash flow. TerrAscend spoke to this possibility on its earnings call.
- Goodness Growth is in precisely the opposite situation. It is not as levered as Curaleaf on an adjusted Debt to EBITDA basis. Still, its stock is trading at such low multiples that the prospect of issuing equity to reduce debt seems unlikely. This is why we anticipated an asset sale like the company’s recently announced sale of its New York licenses and properties.
- Jushi, AYR, Cannabist, and 4Front appear significantly overleveraged in both an EBITDA and Market Cap sense. However, each has some element of optionality that might prove 2024 EBITDA estimates too conservative. For Jushi, it is Pennsylvania and Virginia (although Virginia’s hopes are stymied for the time being by the governor’s veto of legislation that would open adult sales). For AYR, it is Florida. Cannabist is in Ohio, New York, Pennsylvania, and Florida. 4Front is levered to Illinois.
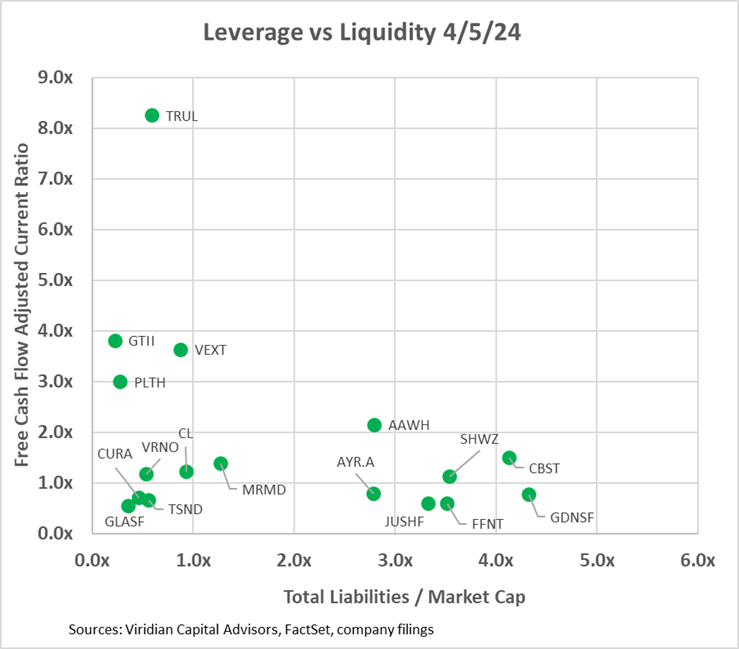
- The third graph introduces the free cash flow adjusted current ratio liquidity measure into the mix. Companies with less than 1x on this measure will likely have to raise capital next year. Six of the companies fall into this bucket.
- Looking at leverage in two ways and having a comprehensive measure of liquidity can give investors a good idea of possible scenarios for today’s overleveraged companies. Companies with low valuation metrics, high EBITDA, market cap basis leverage, and low liquidity include Jushi, 4Front, AYR, and Goodness Growth. Cannabist appears to have reasonable near-term liquidity; however, it is very highly leveraged and trading at discounted multiples.
-
-
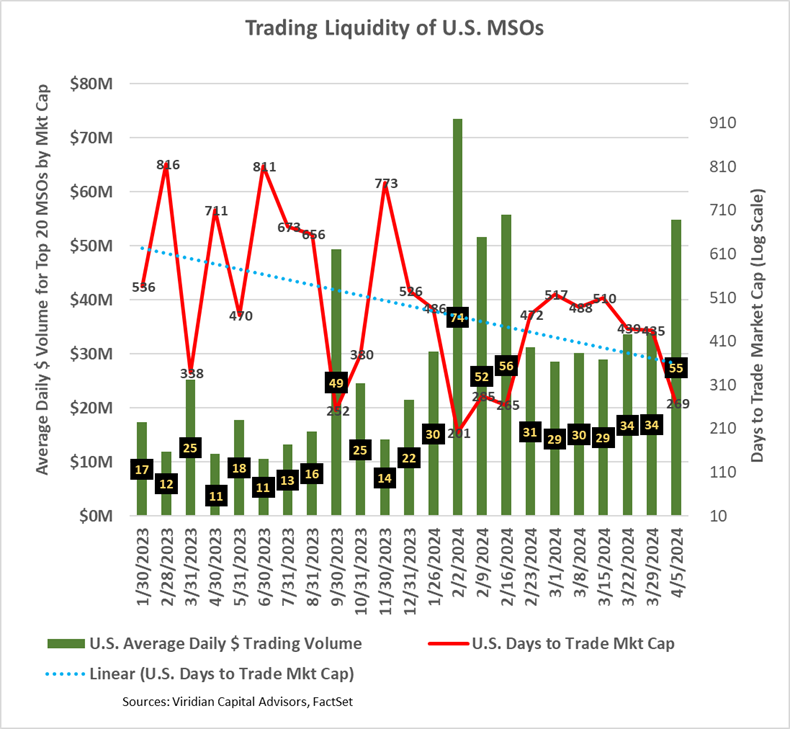
- CANNABIS STOCK LIQUIDITY IMPROVED IN THE MOST RECENT WEEK, TIEING THE LEVELS ACHIEVED AFTER THE HHS ANNOUNCEMENT
- The Days to Trade Market Cap (DTTMC) series depicts the number of days it would take to trade the market cap of a stock or group of stocks. Its most recent reading of 269 days is above the downward trend line shown on the graph. A 269 DTTMC implies that an investor who acquired a 5% position in the stock, assuming he wanted to be less than 25% of the average daily dollar volume, would require 54 days to trade out of his position.
- The increased liquidity is encouraging, but one week doesn’t make a trend.
- CANNABIS STOCK LIQUIDITY IMPROVED IN THE MOST RECENT WEEK, TIEING THE LEVELS ACHIEVED AFTER THE HHS ANNOUNCEMENT
-
-
-
- GIVING CREDIT WHERE CREDIT IS DUE
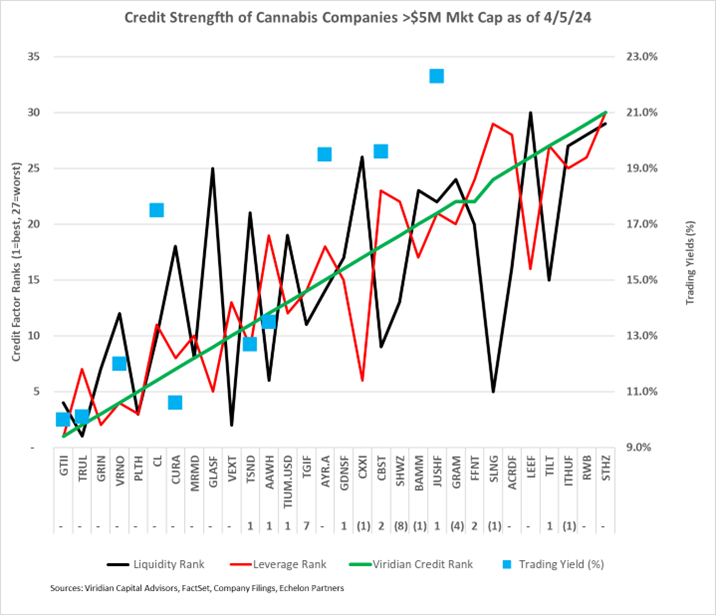
- The chart below shows our updated 4/5/24 credit rankings for the 30 US cannabis companies with over $5M market cap. The number below the ticker symbol indicates the change in credit ranking since last week, where a negative number suggests credit deterioration, while a positive indicates improvement.
- The blue squares show the offered-side trading yields for each company. Trading yields have declined significantly since the HHS rescheduling announcement.
- The rankings spread between Trulieve and Curaleaf held steady this week, with Trulieve with both companies holding their positions from last week.
- Based on this week’s rankings, Curaleaf appears overvalued. It is trading nearly on top of GTI and Trulieve, which we believe are superior credits. Trulieve should trade at a bit wider spread to GTI. Cresco’s senior secured term debt continues to appear too cheap, so trading out of Curaleaf into Cresco seems like a good trade. Jushi’s debt has traded off, appropriately given the governor’s veto of adult rec in Virginia. AYR has significantly more leverage to a Florida rec event, and we believe it should trade at a lower yield relative to Cannabist.
- Jushi trades at a higher yield than comparable credits because the debt is 2nd lien rather than the first lien.
- GIVING CREDIT WHERE CREDIT IS DUE
-
-
-
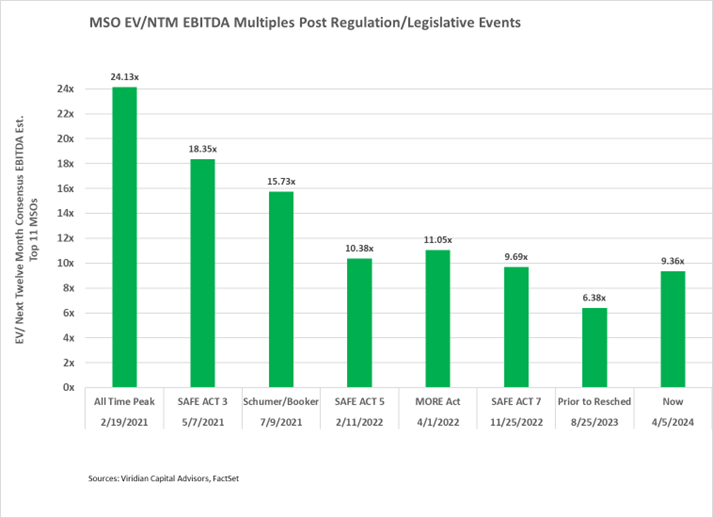
- THERE IS STILL CONSIDERABLE UPSIDE POTENTIAL
- The chart below shows enterprise to next-twelve-month valuation multiples now compared to previous times when positive regulatory/legislative news hit.
- THERE IS STILL CONSIDERABLE UPSIDE POTENTIAL
-
-
- The chart demonstrates a healthy investor skepticism regarding positive regulatory/legislative events in Washington, DC.
- EV/NTM EBITDA Multiples were up sharply this week and are now 11.0% below the levels after the 5th SAFE Act passage in the House in February 2022. Still, the rescheduling news is more significant as it dramatically impacts cash flows. If valuations multiples rose to where they were after the announcement of the Schumer-Booker bill, the incremental gains would equal 68.2%. We view a DEA announcement ratifying the HHS recommendation to be much more significant than introducing the Schumer-Booker bill, which most observers viewed as DOA and had no immediate impact on operator cash flows. Accordingly, we believe there is considerably more runway for price increases, perhaps reaching the 5/7/21 multiples of 18.35x, producing 96.04% returns from current levels.
- We also note, however, that the downside risk from an adverse DEA announcement has grown. If Schedule 3 were to go away (unlikely but possible) totally, we would expect stocks to go back to at least as low as they were before the HHS announcement, and this would imply a 31.8% loss. We think the downside could be a bit more.
- Probability weighting seems like a reasonable approach here, however subjective it may be. We ascribe a 60% chance of a positive DEA announcement that boosts stocks by 68%, a 20% chance of a doubling, and a 20% chance of a loss of 50%. The expected gain from this is approximately positive 51%.
- Cannabis equities (as measured by the MSOS ETF) were up 1.10% for the week.
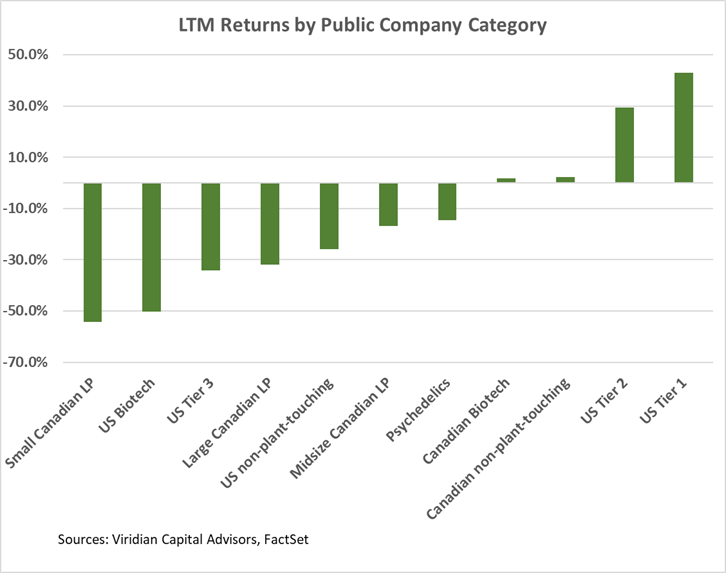
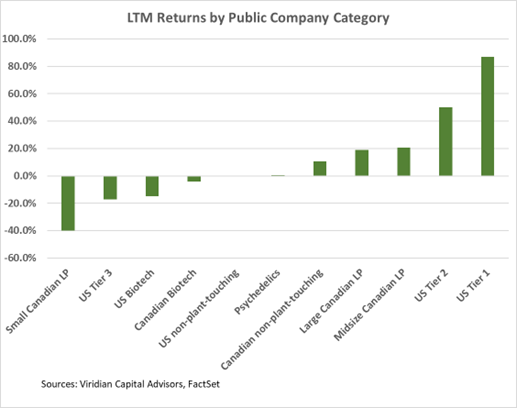
Trailing 52-Week Returns by Public Company Category:
- US Tier One MSOs are now up over 80% for the LTM period, and Large Canadian LPs are now up around 20%. Canopy Growth is still down 36% for the period despite its 230% gain over the previous two weeks.
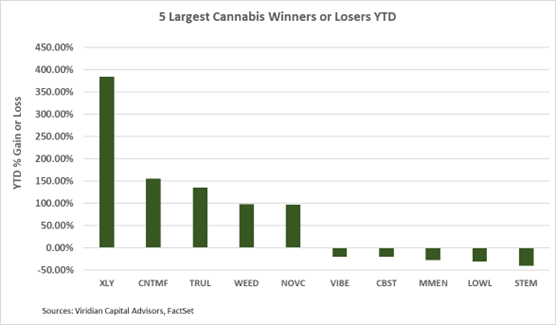
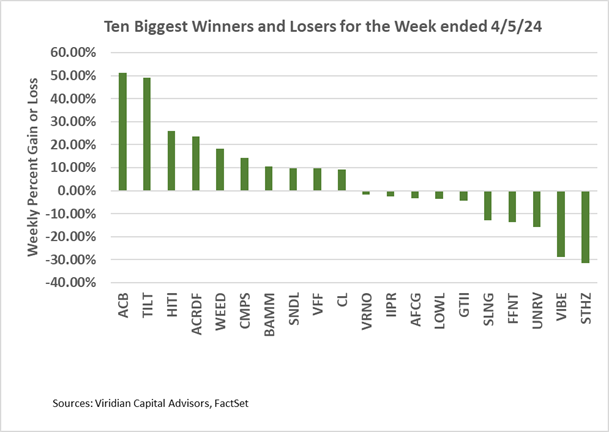
Best and Worst Performers of the last week and YTD:
- Trulieve and Cansortium are the top gainers YTD with over 100% increases. Both would be beneficiaries from Florida Adult Rec., but we think the potential is still much higher, potentially another doubling, without 280e relief! See our Chart of the Week and analysis above for our reasoning.
- Big gainers for the week include many of the significant Canadian names like Aurora (ACB: Nasdaq), High Tide (HITI: Nasdaq), Canopy Growth (CGC: Nasdaq), SNDL (SNDL: Nasdaq), and Village Farms (VLL: Nasdaq).
- Big losers included California players StateHouse (STHZ: CSE), VIBE (VIBE: CSE), and Blum Holdings (BLMN: CSE).