OUR 9TH YEAR OF PROVIDING PROPRIETARY CAPITAL MARKETS INTELLIGENCE ON THE CANNABIS / HEMP / PSYCHEDELIC SECTORS
Each week, Viridian publishes insights and analysis on completed capital raise transactions in the prior week, focusing on all equity and debt deals. Our analysis includes:
- Summary
- Outlook
- Best & Worst Perfromers
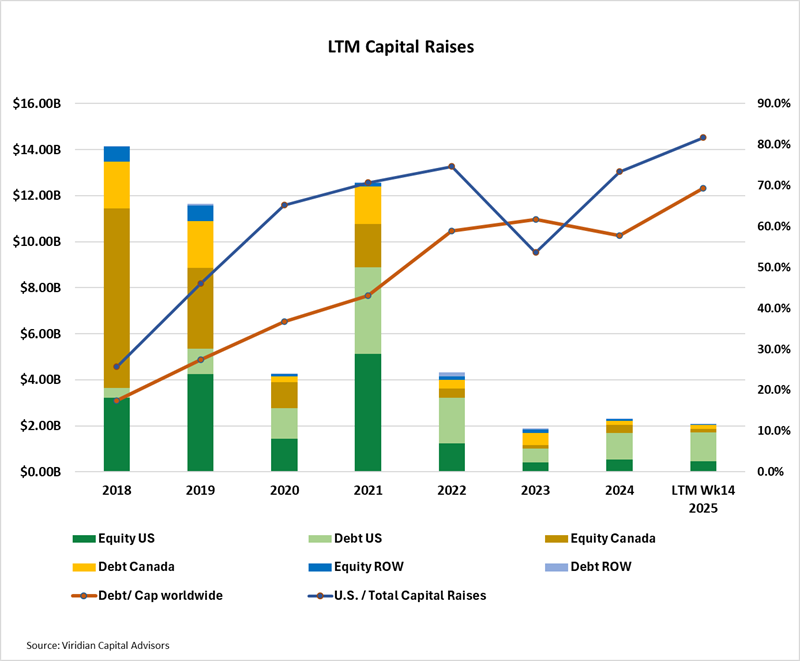
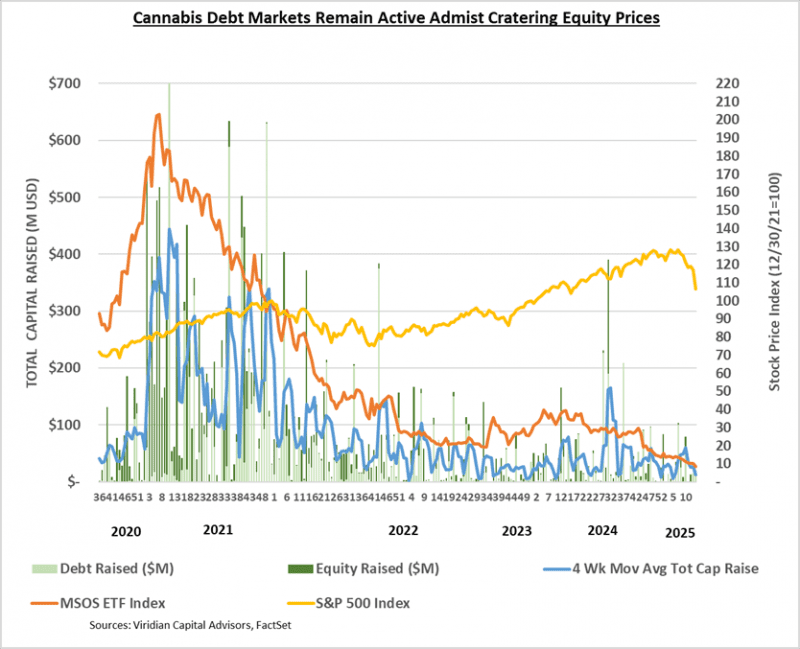
- LTM capital raises totaled $2.09B, down -9.7% from the same period in 2024. Debt as a percentage of capital raised on a worldwide basis was 69.3%, compared to 57.8% last year. U.S. raises LTM accounted for 81.7% of total funds, up from 53.6% at the same point in 2023. Raises from outside Canada and the U.S. represented 1.99% of the total funds raised, falling short of the average of 5.33% in the six previous years.
- Raises by public companies accounted for 79.81% of total raises in the LTM period, the highest since 2021.
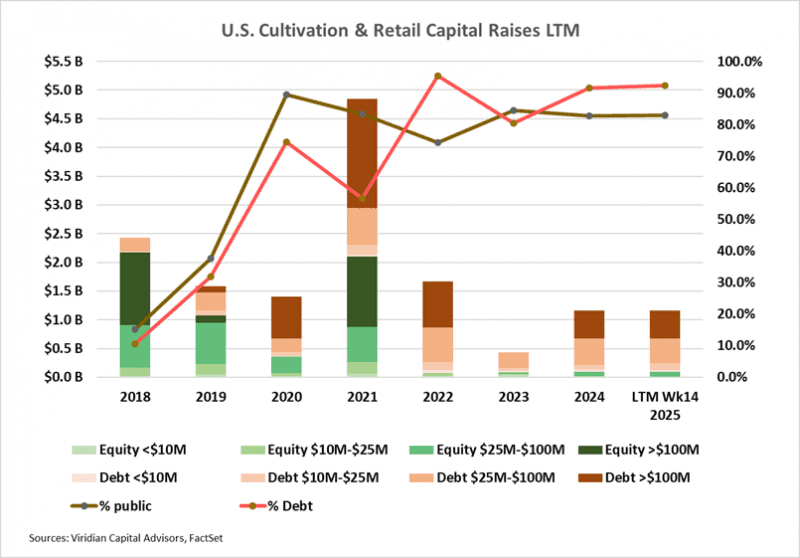
- Cultivation and retail sector capital raises were $1.17B for the LTM period, 0.6% higher than 2024, which in turn was up 167% from 2023.
- Debt accounts for 92.3% of funds raised in the LTM period. Large debt issues (>$100M) represented 41.7% of capital raised compared to zero in 2023.
- Cannabis equity prices (as measured by the MSOS ETF) dropped 17.87% for the week, reaching new all-time lows.

VIRIDIAN INSIGHTS
-
- CANOPY GROWTH JUST PAID DOWN $100M OF DEBT, BUT WHERE DID THE MONEY COME FROM?
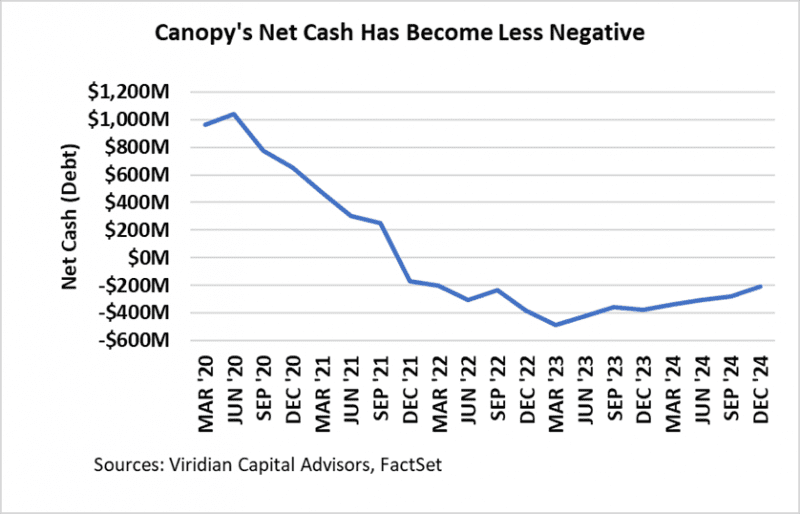
- Canopy Growth (GCC: Nasdaq)(WEED: TSX) put out a press release this week lauding its paydown of $100M of debt at a discount price of $97.5M. Yes, paying down debt is a good thing, and saving approximately $13M in interest expense is a good thing. Moreover, by making two early payments on their term loan, CGC was about to extend the maturity of the loan to September 18, 2027, and that is undoubtedly a good thing. But the story is more complicated than that; after all, where did the money come from?
- The chart below shows the company’s net cash position since the March 2020 quarter.
- CANOPY GROWTH JUST PAID DOWN $100M OF DEBT, BUT WHERE DID THE MONEY COME FROM?
-
-
- When we read about the paydown, we assumed that the company just reduced cash and reduced debt, thereby leaving net debt unchanged. After all, we are talking about a company with an unbroken 20-quarter record of negative EBITDA and negative cash flow from operations, which by itself is quite an achievement. Not many companies can do that and remain solvent!
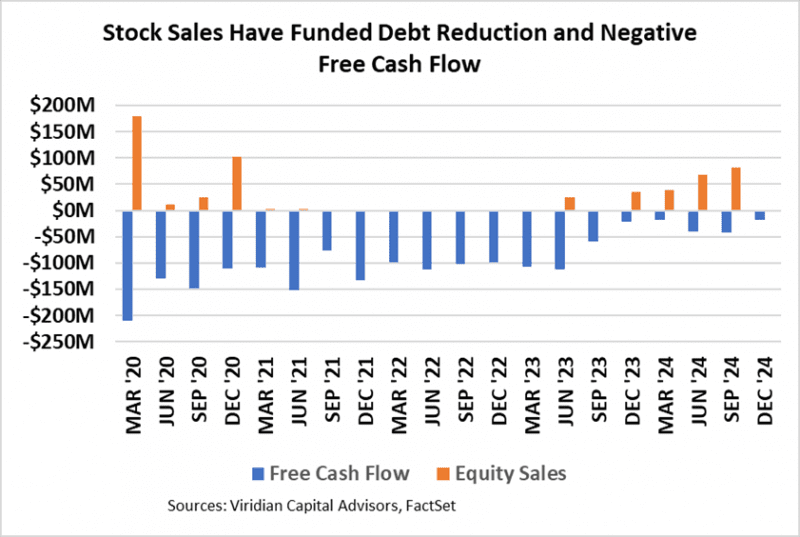
- The chart below shows the real story. The company has managed to reduce its negative cash flow from operations and slim down its CAPEX to reduce its negative free cash flow (depicted by the blue bars on the chart). Still, consensus cash flow from operations estimates for the fiscal years ended March 2025, 2026, 2027, and 2028 are -$91M, -$30M, -$29M, and -$44M, stubbornly refusing to break the surface.
- The company has managed to reduce net debt through the issuance of common and preferred stock (shown by the orange bars). Canopy has remarkably been able to sell approximately $250M of equity over the last five quarters, nearly twice as much as the entire U.S. Cultivation and Retail segment over the same period!
- Cannabis never ceases to amaze: Canopy, a company that has never been cash flow or even EBITDA positive, is able to sell purely dilutive stock at will, while the U.S. equity market for plant-touching companies is essentially shut down. You cannot make this stuff up.
-
-
- IN ANY OTHER MARKET, CANNABIST WOULD BE GETTING SOME CREDIT FOR ITS DEBT RESTRUCTURING PLAN
- Cannabist’s bonds have rallied a bit since the announcement of the deal, but we expected to see a boost in the stock, which has not yet occurred. CBST has approval from approximately 70% of its bondholders, clearing the 66 2/3% level generally required. A special meeting of bondholders is scheduled for April 29.
- Cannabist’s announced debt restructuring plan looks eerily similar to the one that AYR executed at the beginning of 2024: The company gave up around 25% of its equity to extend debt maturities to 2028 with two six-month extensions. Holders of existing notes will receive dollar-for-dollar exchanges into similar coupons with longer maturities. Holders who committed to the plan early will also receive a pro-rata share of a $1.5M early consent fee.
- Like AYR, the company is not extinguishing any debt in the plan. It will remain arguably overleveraged, but the stakes are survival and this plan gives the company significant time to improve its profitability and make other operating and capital structure moves.
- We applaud Cannabis management for making an early move to address a worrisome upcoming series of debt maturities. We had ranked the company’s situation as one of the most perilous (along with AYR).
- Our calculations show that the completion of the restructuring should have had a significant impact on the stock. In fact, we think it could go up by a factor of 2.6x to around $.13 per share! Total liabilities to market cap would improve from 26.9x to 10.7x, still a distressed credit but not disastrous. So far, the equity market has not realized the value of the 2-3 year reprieve.
- GAUGING THE RISK OF THE 2026 DEBT MATURITY BUBBLE
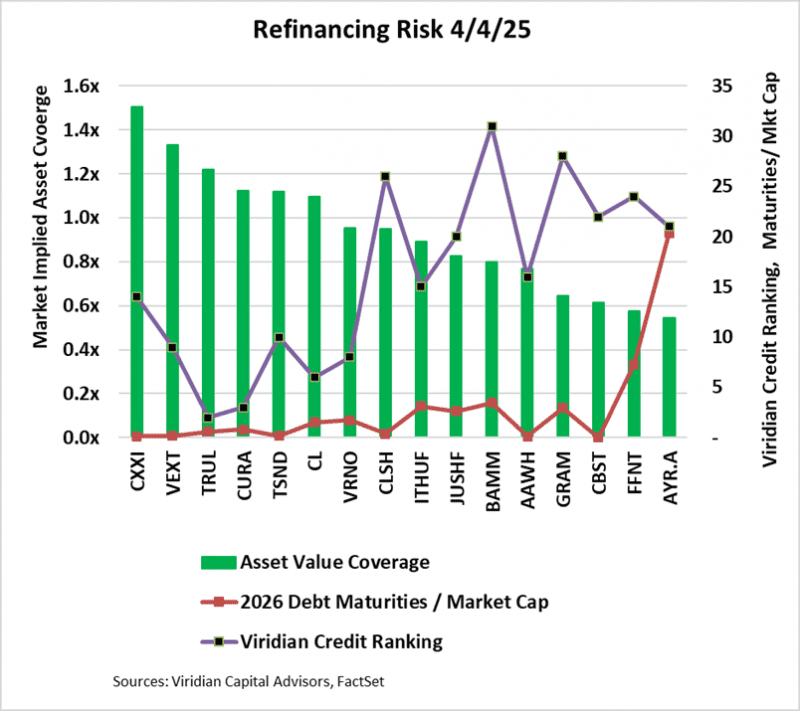
- Much has been made of the upcoming wave of cannabis debt maturities in 2026. The sheer size is undoubtedly intimidating. The companies pictured on the graph below collectively have about $2.6B of debt maturing in 2026. (IAnthus maturities are actually in 6/27, but close enough!). Putting that figure into perspective, $2.6B is greater than the total capital raised for the cultivation & retail sector for any year since 2018 except for 2021.
- Viridian is generally more constructive about the issue than most other industry observers. We observe that in the high-yield bond market, it is virtually never the case that debt is paid off in cash. It is generally refinanced, OR the company is forced to restructure. Obviously, given the lack of prepack bankruptcy (or any bankruptcy for that matter), restructuring is rightfully a prospect to be feared in cannabis.
- So, how do we gauge the risk of something going wrong in 2026? Refinancing risk is a peculiar mixture of market psychology and financial realities.
- Successful completion of the Cannabist plan discussed above should have a positive impact on the market psychology regarding the other troublesome maturities. However, that effect has been clouded by overall market turmoil. And lest we seem Pollyannaish, we do recognize that several companies are looking increasingly troublesome. The graph below shows three relevant data points:
- The green bars show the 4/4/25 market-implied asset coverage of total liabilities. We arrive at this by looking at the equity as a call option on the asset value of the firm, with a strike price of its liabilities, and with assumed maturities (2026) as well as volatility assumptions (40%) and risk-free rate (4.25%). This gives us all of the elements of the Black-Scholes option pricing formula except for the current asset value. By iterating the solution of the BS model, we can find the market’s assumption for asset value. The importance of this data point should be obvious. For companies with under 1x asset coverage of liabilities, debt providers are genuinely making an equity bet. They do not have adequate asset value coverage to fall back upon.
- The purple line represents the Viridian Capital credit ranking, which takes into account four key credit factors: Liquidity, Leverage, Profitability, and Size. Refinancing will be more difficult for weaker credits (higher numbers). Companies with ranks of under 16 are in the top half of the Viridian-ranked universe of credits.
- The red line represents the multiple of market cap that 2026 debt maturities represent. Clearly, the larger the debt maturities relative to the market cap, the more difficult we would expect refinancing to be. The seven companies from ITHUF to the right side of this graph (except Cannabist) represent high risk. They have less than 1x asset value coverage, poor Viridian Credit Ranks, and maturing debt that is a multiple of market cap. Companies in this position represent approximately $867M of the maturing debt. Conversely, the five companies on the left-hand side of the graph represent low refinancing risk. They have solid asset coverage, strong Viridian Credit Ranks, and maturing debt that is less than 1x market cap. These companies represent $1.6B of the $2.6B total (62%), and we believe they should all be able to refinance their maturities without undue pain.
- AYR (AYR.A: CSE) continues to head in the wrong direction. The company’s Viridian Credit Rank worsened from #16 to #21, Its asset coverage declined to .60x, and its market fell to the point where its 2026 debt maturities now represent around 20 times the market cap. The announced Cannabist deal looks surprisingly like the one AYR did at the beginning of 2024. Can AYR turn around and do it again? With the debt trading at significant discounts and the equity trading like an out-of-the-money option, it’s going to take something big to pull AYR out of the fire. Selling AYR’s four stores in Illinois is not likely to be sufficient to make much difference. We would not be surprised if AYR attempted to sell its Virginia assets, which are probably worth more than the Illinois properties, but they may still not be enough to make much progress on the looming debt maturities. AYR’s bonds are offered at yields of more than 30%. The market is pretty clearly considering AYR a restructuring candidate rather than a refinancing candidate. Recent management changes seem to ratify that view.
- Meanwhile, this week, two of the companies on the graph, FFNT and GRAM, defaulted on their mission-critical leases with IIPR. We didn’t expect things to come to a head quite this fast.
- IN ANY OTHER MARKET, CANNABIST WOULD BE GETTING SOME CREDIT FOR ITS DEBT RESTRUCTURING PLAN
-
- FOUR KEY GRAPHS THAT SEEK TO MAP THE OPTIONS AVAILABLE TO THE MSOs BASED ON THEIR VALUATION, LEVERAGE, AND LIQUIDITY
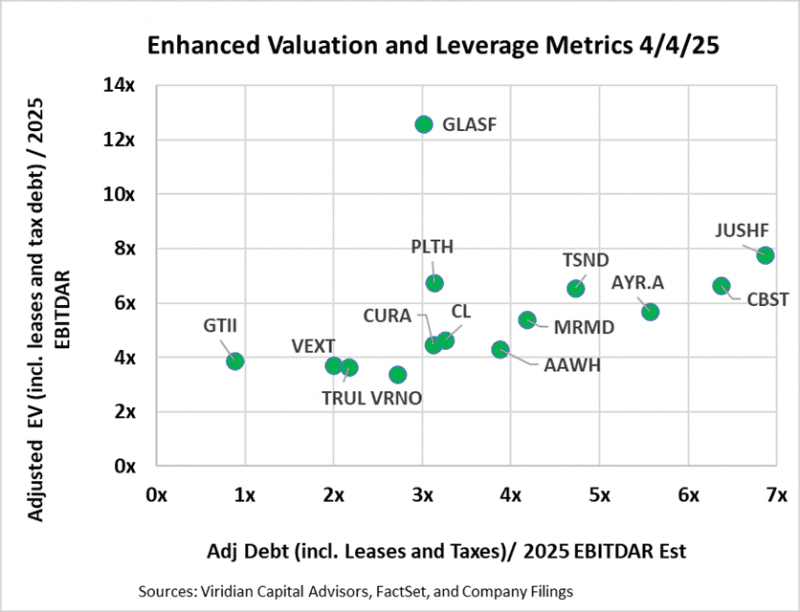
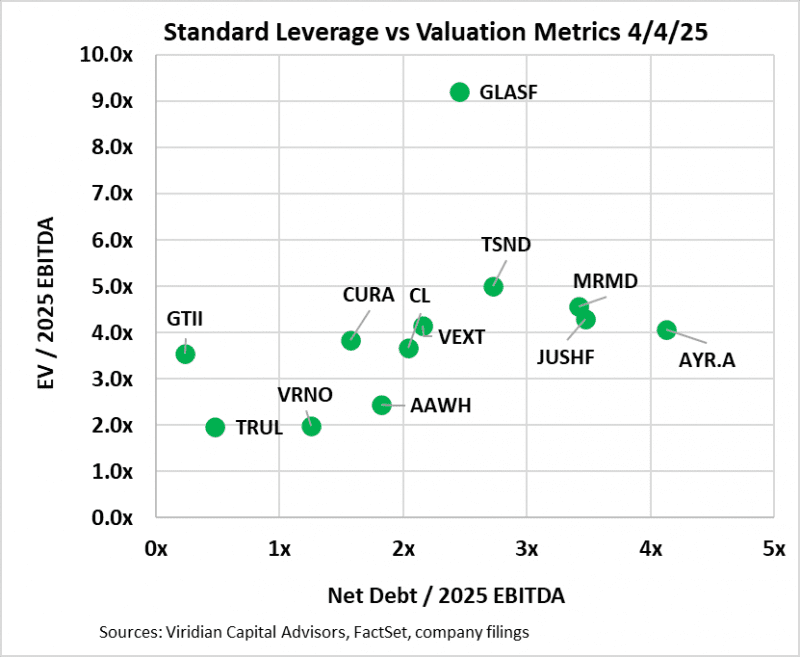
- The first two graphs present different versions of EV/EBITDA on the vertical axis and Debt/EBITDA on the horizontal axis.
- The first graph presents our latest view of the most appropriate valuation and financial statement-based leverage metrics: Adjusted EV / 2025 EBITDAR and Adjusted net debt / 2025 EBITDAR. In calculating Adjusted Net Debt, we make several key assumptions: 1) Leases that are included on the balance sheet are considered debt. We view most leases in the cannabis space as equivalents to equipment loans or mortgage loans. While it is true that a lease default does not necessarily trigger a cascade of events leading to bankruptcy, the distinction is often meaningless in cannabis due to the mission-critical nature of many long-term leases and the absence of bankruptcy protection in cannabis. 2) We consider any accrued taxes (including uncertain tax liability accounts listed as long-term liabilities) in excess of the most recent quarterly tax expense to be debt. Our calculation of enterprise value is now market cap plus debt plus leases plus tax debt minus cash. We now use EBITDAR rather than EBITDA since lease expense is taken out prior to EBITDA.
- The second graph utilizes EBITDA and employs the traditional calculations of both debt and enterprise values, leaving out leases and taxes.
- Our adoption of new metrics tends to make the companies look less cheap and more leveraged.
- Surprisingly, nine of the companies on the enhanced metric chart are still above 3x leverage, which we have identified as the boundary of sustainability in a 280e environment. Four companies now exceed 4x leverage, which we believe will be close to the maximum sustainable post 280e.
- Jushi and TerrAscend appear as leverage outliers using the new metrics relative to AYR and Cannabist, which seemed more leveraged using standard measures.
- Glass House is a valuation outlier. We have been positive on Glass House for quite a while, but the multiple spread to the nearest competitor is straining our resolve. We note GLASF’s $25M at the market equity issuance facility as another factor likely to restrain price appreciation.
- FOUR KEY GRAPHS THAT SEEK TO MAP THE OPTIONS AVAILABLE TO THE MSOs BASED ON THEIR VALUATION, LEVERAGE, AND LIQUIDITY
-
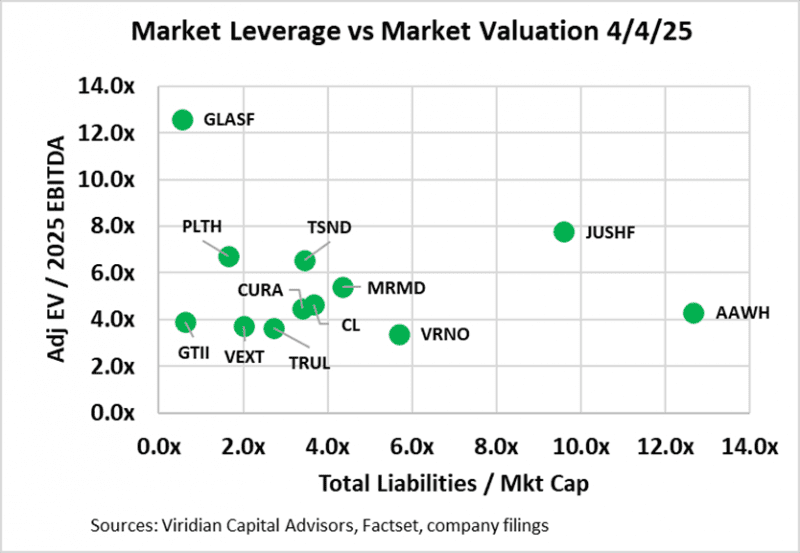
- The third graph looks at leverage through the lens of total liabilities to market cap. We believe this is the single best measure of leverage because it is a direct reflection of the market’s assessment of the value of a company’s assets in excess of its liabilities and is sensitive to changes in market perception of a company’s future.
- On the bottom left are companies with Adj EV/2025 EBITDAR of under 6x and total liabilities to market cap under 2x. The group includes Vext, GTI, and Trulieve. Companies in this quadrant are right to consider stock repurchases or using cash in acquisitions. They can afford some additional debt and can take advantage of the ongoing dislocation in equity prices.
- In the middle, between 2x and 5x total liabilities/market cap, we see Verano, Cresco, and MariMed. Verano and Cresco both have significant 2026 maturities, but we do not believe either is likely to have difficulties refinancing their debt.
- On the right lies Jushi and Ascend, both between 6x and 10x. a range that signals stress if not distress.
- AYR, 4Front, Cannabist, and Schwazze are now off the chart to the right, signaling profound credit risk. Our recent work using option modeling of equity prices showed that the market believes each of these companies has significantly less asset value than liabilities.
- The third graph looks at leverage through the lens of total liabilities to market cap. We believe this is the single best measure of leverage because it is a direct reflection of the market’s assessment of the value of a company’s assets in excess of its liabilities and is sensitive to changes in market perception of a company’s future.
-
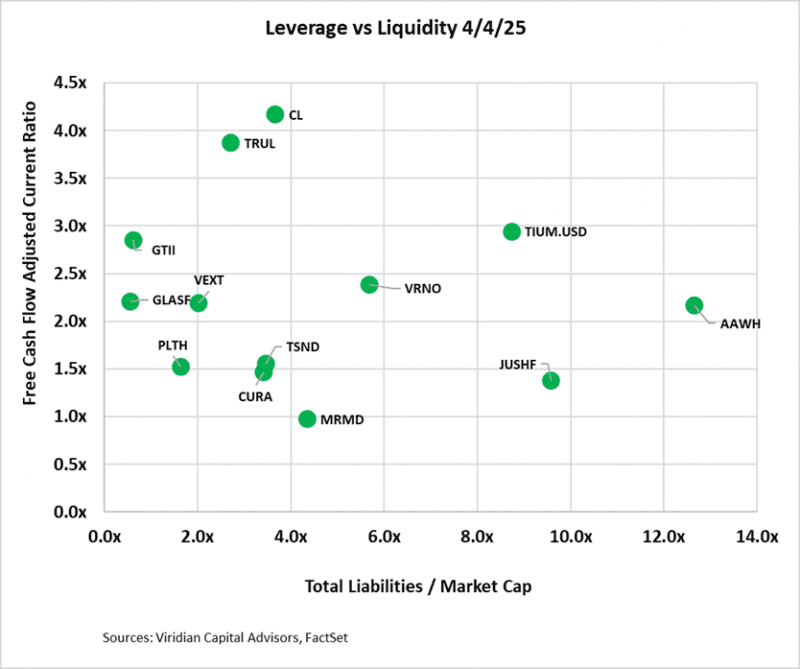
- The fourth graph introduces the free cash flow adjusted current ratio liquidity measure into the mix. Companies with less than 1x on this measure will likely have to raise capital next year.
- On the top left, we find companies with adequate liquidity and low market leverage, including both GTI and Planet 13.
- Companies in the lower middle-to-right generally have constrained liquidity and high leverage, a potentially dangerous combination in a capital-constrained environment. Five, including Schwazze, Cannabist, Ascend, MariMed, and 4Front These companies are high-risk with both high market leverage and low liquidity.
-
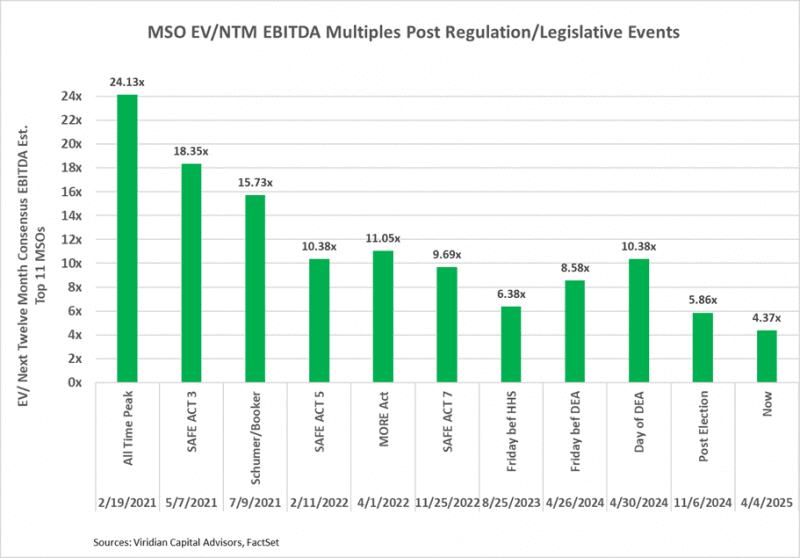
- VALUATION METRICS SUGGEST STRONG DOUBT REGARDING RESCHEDULING AND OTHER CANNABIS REGULATORY REFORM
- The chart below shows that cannabis companies are trading at historically low valuation metrics – significantly lower than before S3 was a gleam in HHS’s eyes. Granted, there are a host of industry-specific problems that go beyond regulatory reform: slowing growth, wholesale pricing pressure, a weary consumer, etc.
- We continue to believe that at current levels, U.S. MSOs have enormous upside potential. We are not pollyannish about the issues and do realize the industry has a number of deep-seated problems, like competition with hemp, wholesale price compression, and dependence on new markets for growth. Moreover, it likely requires some political catalysts to achieve significant gains, and the market is beyond worrying about timing and is concerned that these reforms may never transpire. The graph below shows the multiples reached after a number of past legislative/regulatory events. It makes clear that a doubling of prices is a reasonable possibility.
- However, it is increasingly important to focus on building a diversified portfolio of companies that can make it without help from Washington because it’s anyone’s guess when that will arrive. Focus on the top 10 companies in our credit rankings. There ARE investable companies besides GTI. Put them in your portfolio and follow the total liabilities to market cap indicator, as well as the credit tracker rankings.
- VALUATION METRICS SUGGEST STRONG DOUBT REGARDING RESCHEDULING AND OTHER CANNABIS REGULATORY REFORM
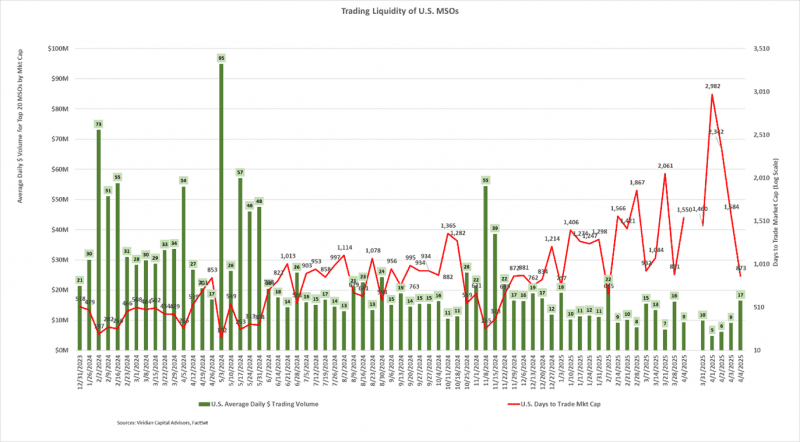
- MSO TRADING VOLUME FALLS ON TARIFF CHAOS
- The average daily dollar volume of $9M for the week ending 4/4/25 was the third-lowest figure since the end of 2023.
- The Days to Trade Market Cap (DTTMC) series depicts the number of days it would take to trade the market cap of a stock or group of stocks. The current DTTMC of 1550 returns to its previous highs. A DTTMC of 1550 implies that an investor who acquired a 5% position in the stock, assuming he wanted to be less than 25% of the average daily dollar volume, would require 310 days to trade out of his position.
-
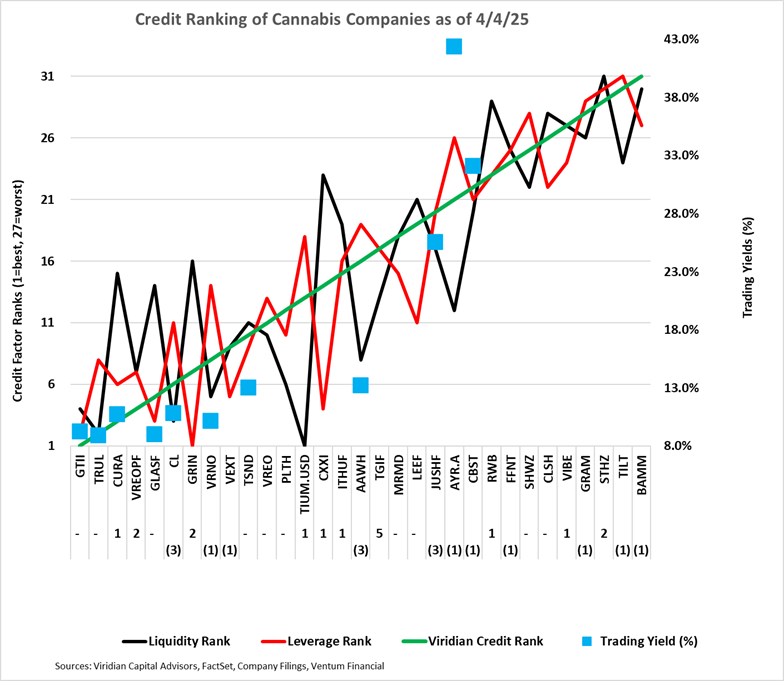
- GIVING CREDIT WHERE CREDIT IS DUE
- The chart below shows our updated 4/4/25 credit rankings for 31 U.S. cannabis companies. The number below the ticker symbol indicates the change in credit ranking since last week. A negative number suggests credit deterioration, while a positive number indicates improvement.
- The blue squares show the offered-side trading yields for each Company. Cannabist yields initially dropped significantly to the mid-20% range with the announcement of the company’s restructuring plan but have now drifted back into the upper 20s. AYR 13s of 26 are offered in small size at 70 for a yield in the upper 30s, indicating a market belief that a restructuring rather than a refinancing is the base case assumption.
- GIVING CREDIT WHERE CREDIT IS DUE
- Cannabis equity prices (as measured by the MSOS ETF) dropped 17.87% for the week, reaching new all-time lows.
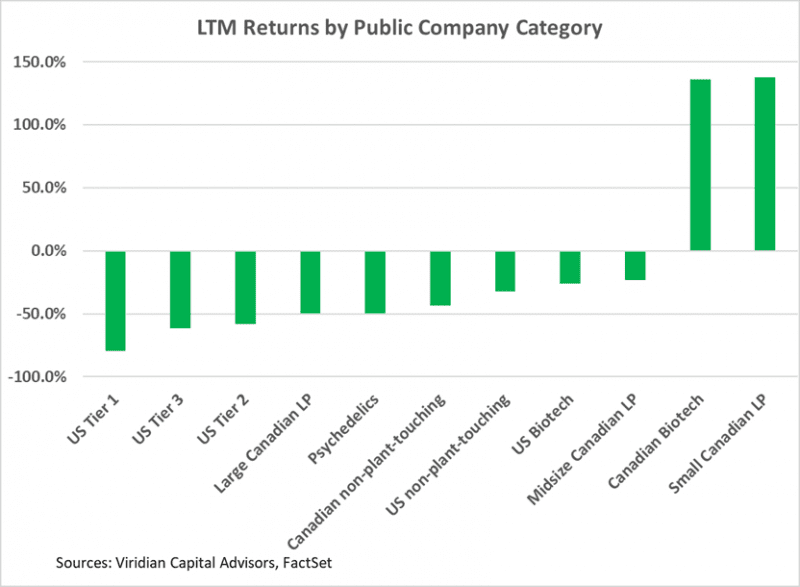
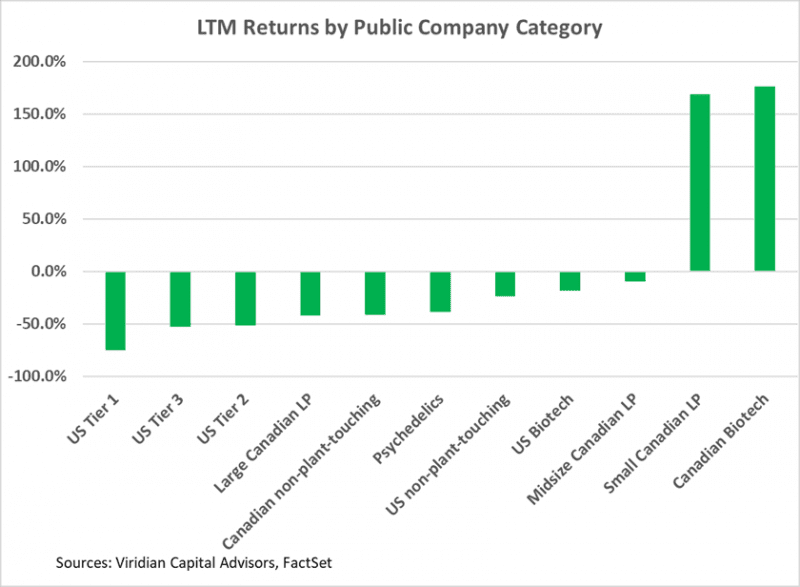
Trailing 52-Week Returns by Public Company Category:
-
- U.S. Tier one through three MSOs now are the worst three YTM return categories, which is not that surprising given that many of these stocks are now trading at or near all-time lows. Tier one is now down 74% for the LTM period. The most significant change since last week is the two-notch improvement in Psychedelic sector YTM returns, which now clock in at -33%.
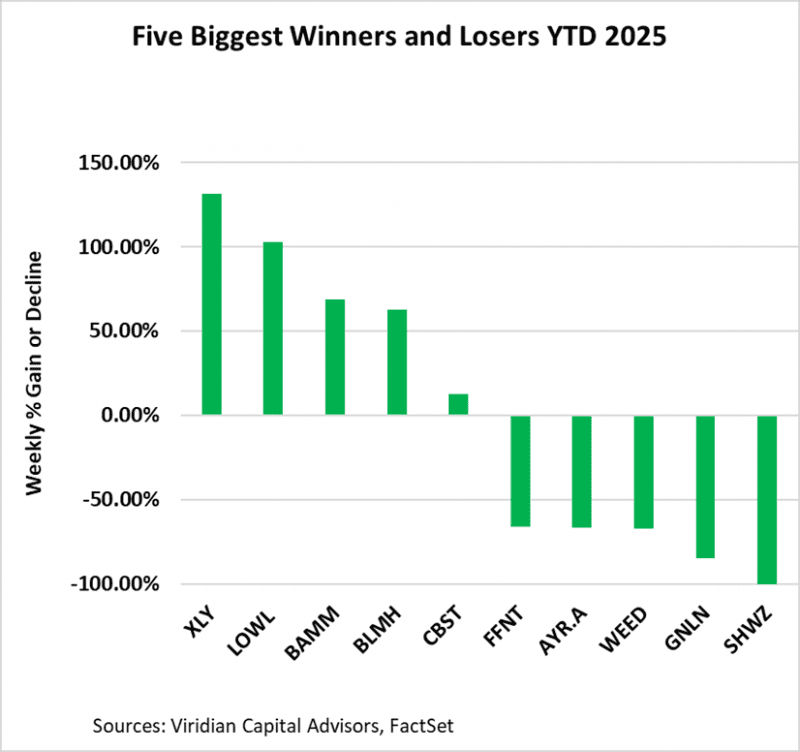
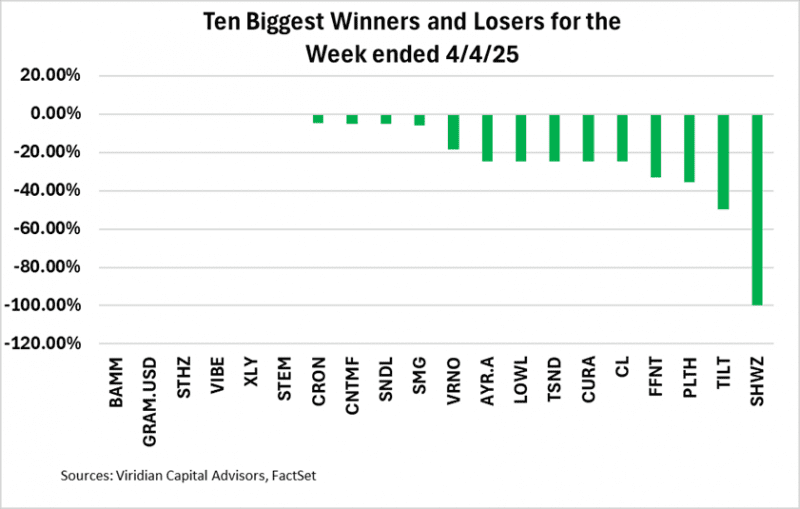
Best and Worst Performers for the week: