OUR 9TH YEAR OF PROVIDING PROPRIETARY CAPITAL MARKETS INTELLIGENCE ON THE CANNABIS / HEMP / PSYCHEDELIC SECTORS
Each week, Viridian publishes insights and analysis on completed capital raise transactions in the prior week, focusing on all equity and debt deals. Our analysis includes:
- Summary
- Outlook
- Best & Worst Perfromers
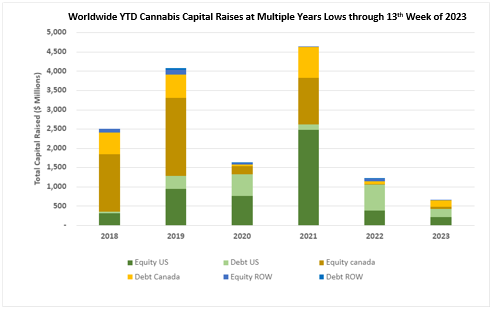
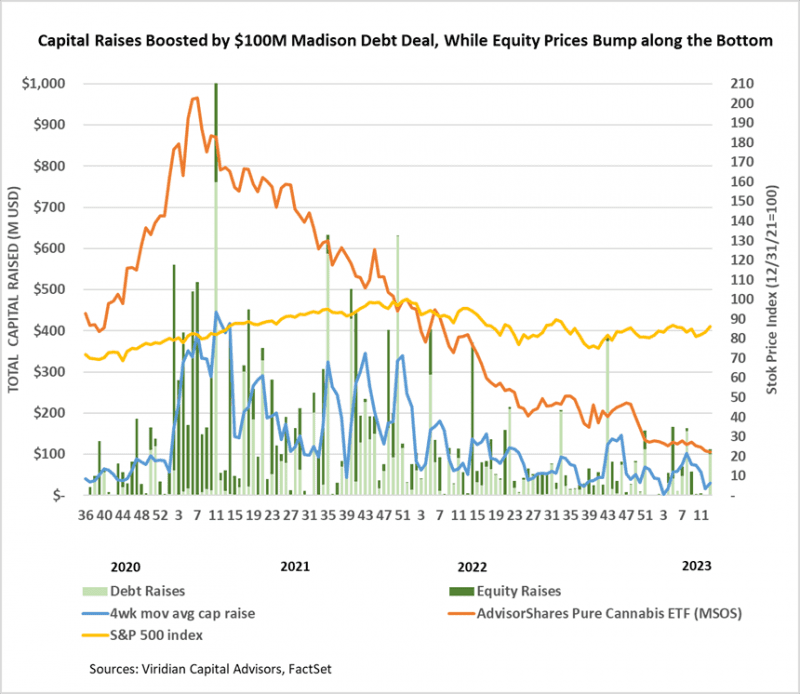
- Cannabis capital raises are off to a multi-year low. Only $658.07M closed through the first thirteen weeks of the year compared to $1,213.61M last year.
- Debt represents 59.2% of total capital raised, down from the 61.6% registered in 2022 but higher than in any other comparable period back to 2018.
- Public companies have raised only 54.7% of total capital YTD, down from 76.9% last year.
VIRIDIAN INSIGHTS
- Oil Shock? What Oil Shock? The market shrugged off the unexpected Saudi move to reduce oil production (and increase oil prices), with the S&P500 down less than 1% on the news. Increased energy costs hit indoor cultivators hard, resulting in more significant declines for the MSOs. The move may further complicate Jay Powell’s efforts to control inflation and could be the surprise that finally kicks off the most anticipated recession in history. Stay tuned.
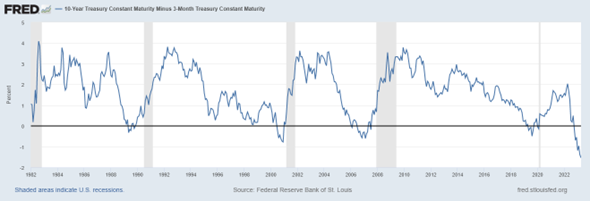
- The banking crisis has turned into the death of 1000 cuts as bank deposits continue leaking out of the banking system. Bank deposits haven’t proven to be as “sticky” as in the past. The conundrum facing banks is seen in the 3-month/10-year curve inversion unmatched in the last 20 years. The curve shows that traditional bank lending becomes unprofitable if banks match money market yields on their deposits. This is one of the reasons that an inverted curve is a good recession predictor.
- Earnings releases are mainly over, and, as usual, we focus more on revisions of earnings estimates than on beats or misses. The chart below shows the percentage change in consensus analysts’ estimates of 2023 EBITDA. The picture isn’t a pretty one. Eight out of 19 companies had greater than 10% downward revisions in the month. Only one company on the chart, Acreage (ACRDF: OTC), had an upward revision. Another standout was Glass House Brands, which is not pictured, but swung from an expected loss to a positive expected 2023 EBITDA.
- YTD, US Cultivation & Retail sector capital raises are down 86.2% from 2022.
- Debt is still the only game in town, accounting for 89.4% of all cultivation sector capital raised. The vast majority of the debt raised has been for public companies.
- Large transactions are still absent from the market. There have been no debt or equity deals over $100M YTD.

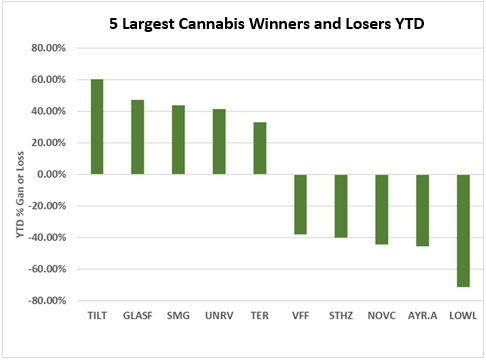
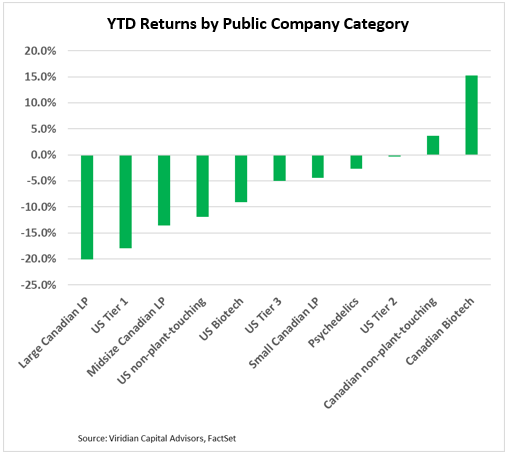
YTD Returns by Public Company Category
- All three tiers of U.S. MSOs now have YTD negative returns, and the large Canadian LPs and Tier one U.S. MSOs are the two worst-performing categories. Nine of our eleven categories are now showing YTD losses.
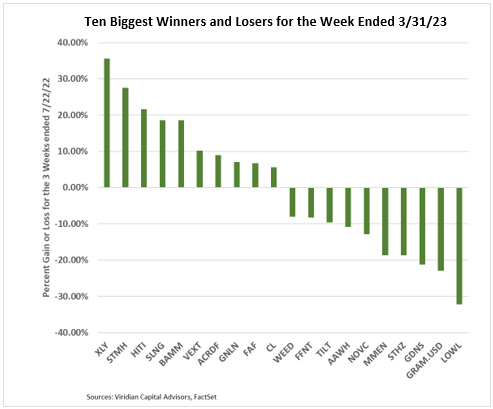
Best and Worst Performers of the last week and YTD
- The trading pattern of winners vs. losers features high-volatility reversion to the mean. The top two winners this week, Auxly (XLY: TSX) and Stem Holdings (STMH-OTC), both up more than 25%, were the top two losers last week, down by similar percentages. Similarly, Lowell Farms (LOWL: CSE), this week’s biggest loser, down by 36%, was last week’s biggest gainer by a similar percentage. Does any of this mean anything? Probably not much since each of these companies is trading like an out-of-the-money option.
- On the other hand, the Parent Company (GRAMF: OTC) has been down more than 20% for two weeks in a row.
- Goodness Growth (GDNS: CSE) is a new name on our losers list, down 21% on two pieces of financing news. One was that they granted Chicago Atlantic (REFI: Nasdaq) 15m shares worth approximately $1.65M as a fee to amend their credit agreement, removing amortizations and extending the maturity by one year, a hefty fee for a one-year extension! Secondly, GDNS announced that it was in talks with an affiliate of REFI on a $10M senior secured convertible note with a 12% coupon (including 6% in PIK) and three-year maturity. The deal is expected to include warrants to purchase 6.25M shares. Details about the conversion premium and exercise premium were not available. The table below shows the effective cost of the notes depending on the conversion premiums and warrant exercise premiums. Note that the figures below do not consider any OID or fees that will likely increase the effective cost. The cost depends mainly on the conversion premium because the implied warrant coverage is less than 10% for most warrant exercise prices.