OUR 9TH YEAR OF PROVIDING PROPRIETARY CAPITAL MARKETS INTELLIGENCE ON THE CANNABIS / HEMP / PSYCHEDELIC SECTORS
Each week, Viridian publishes insights and analysis on completed capital raise transactions in the prior week, focusing on all equity and debt deals. Our analysis includes:
- Summary
- Outlook
- Best & Worst Perfromers
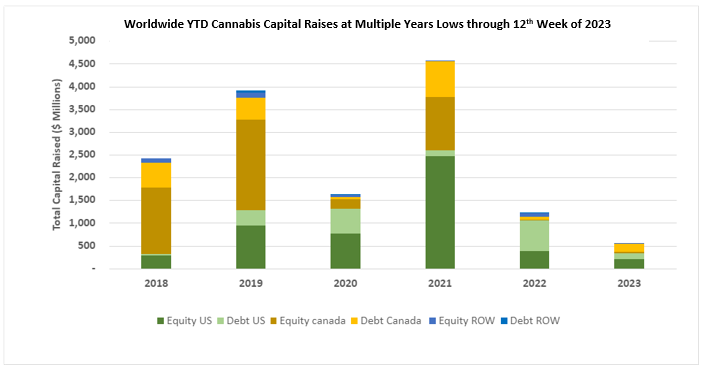
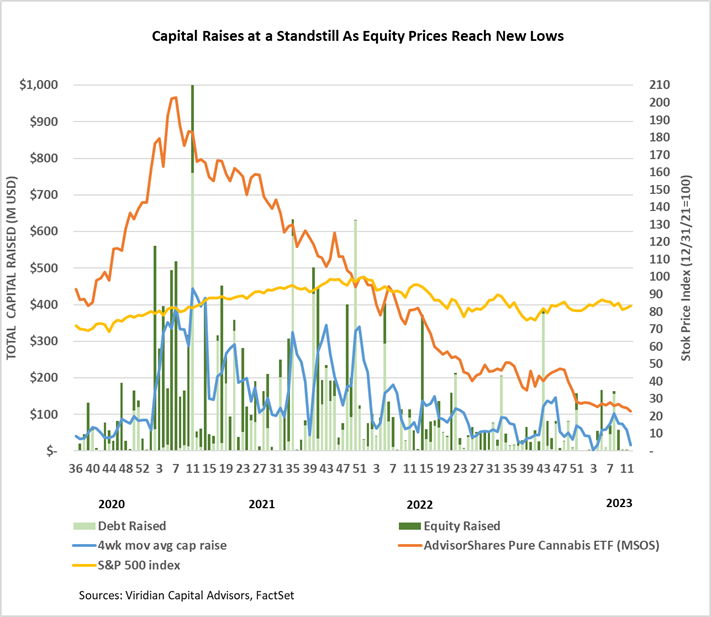
- Cannabis capital raises are off to a multi-year low. Only $545.88M closed through the first twelve weeks of the year compared to $1,208.17M last year. This week’s total capital raise volume is the lowest since the May 11, 2020. The trailing 4 week volume is the third lowest since June 2019 with the other two lowest weeks also occurring in 2023.
- Debt represents 53.0% of total capital raised.
VIRIDIAN INSIGHTS
- The banking crisis is on hold. The market was temporarily calmed by First Citizens Bank buying $72B of Silicon Valley Bank assets at a discount of around $16.5B, with the FDIC agreeing to share in some of the gains or losses from the loans purchased. Still, the fate of First Republic Bank (FRC: Nasdaq) hangs in the balance. Regulators announced on Tuesday that the bank was no longer for sale, leaving the market to parse the meaning of that revelation.
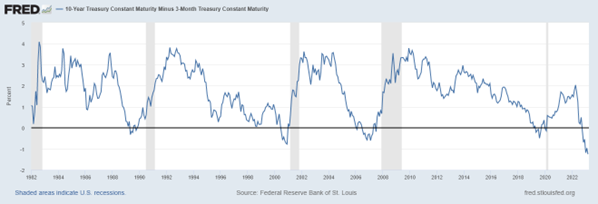
- As expected, the banking crises did not keep Jay Powell from increasing rates by 25 bp. Interest rate futures now predict rate cuts in the latter half of 2023 with the rationale that significant cuts will be required to forestall the impact of an impending recession. We are not convinced that Powell will blink, however. The 3-month/10 year spread curve below shows an inversion unmatched in the last 20 years. Note that it is not the deep inversion that has signaled each of the previous five recessions; the reversal of the inversion typically gives a 6-9 month recession indicator. The 2-10 curve has become less inverted, which may be the beginning. Buckle up. We’ve never seen a curve like this one.
- MSOs continue to tighten their reigns to conserve cash. This week’s announcement that Curealef is closing a facility in New Jersey and laying off 40 people was a bit of a surprise to us. After all, NJ has some of the highest cannabis prices in the nation and seemed to be the poster child of new market profitability. It shows what we have talked about here for some time: the period of extreme profitability between when a market first goes rec and when wholesale pricing begins to fall is shortening.
- Pricing gains in Michigan and California offer hope that market consolidation might yield more price stability. But it may be a case of too little and too late in both markets. Skymint, one of the two largest integrated operators, is in receivership with an uncertain future in Michigan. The second largest operator, TerrAscend (TER: CSE), has also been burned by Michigan. TER purchased Gage and Pinnacle for a combined total of $353M and just took a $311M writedown. In California, pricing is firming after nearly 1000 cultivation licenses failed to renew. Many dispensaries continue to operate on the edge. The stage is set for consolidation, but everyone wants to be a settler, not a pioneer.
- YTD, US Cultivation & Retail sector capital raises are down 86.2% from 2022.
- Debt is still the only game in town, accounting for 89.4% of all cultivation sector capital raised. The vast majority of the debt raised has been for public companies.
- Large transactions are still absent from the market. There have been no debt or equity deals over $100M YTD.

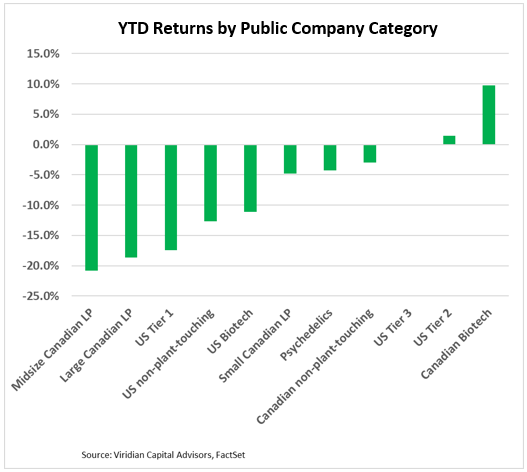
YTD Returns by Public Company Category
- The relative ordering of YTD returns by category is mostly unchanged from last week, except for US Tier 1 MSOS, which have lost another ranking notch since the previous week. The best-performing categories continue to be tier 2 and 3 U.S. MSOs. Eight of our eleven categories are now showing YTD losses.
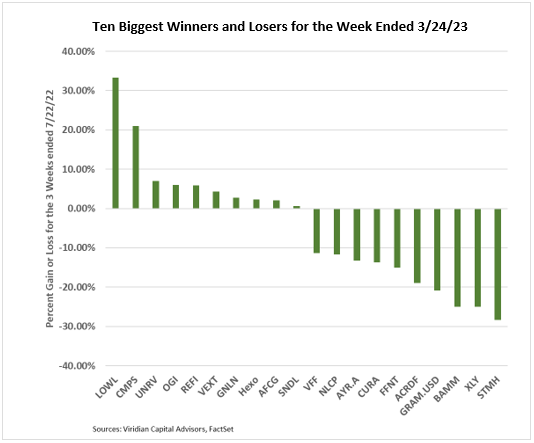
Best and Worst Performers of the last week and YTD
- Best and Worst Performers of the last week and YTD
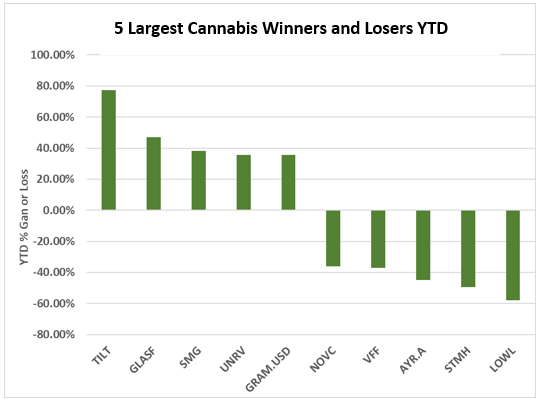
- Nearing the end of Q1, the top 3 performers YTD are:
- Tilt Holdings (TILT: NEO), up nearly 70% through its active liability management actions, which substantially cured its potential liquidity crises
- Glass House Brands (Glasf-OTC) is up 47% YTD on cost efficiency improvements and increased California pricing.
- Scotts Miracle Grow (SMG: Nasdaq) continues to hold on to a 38% YTD gain despite guidance that its Hawthorne business will likely experience a 20-25% revenue decline in 2023. Hawthorne also shows high year-end inventories (over 190 days), portending additional margin declines.
- The three worst performers YTD are:
- Lowell Farms (LOWL: CSE) is down 57% YTD despite a 33% gain this week on news of an agreement with George Allen under which the company will eliminate its near-maturity convertible debt in return for issuing 100M shares and transferring ownership to some critical IP. Although the basic idea of a debt-for-equity swap makes excellent sense, we have not been able to come up with a valuation for the post-transaction shares that makes sense and brand IP value that balances the canceling of the debt.
- Stem Holdings (STMH: CSE) is down 49% YTD after it announced a merger transaction with Headwaters LLC which will result in equity holders of Headwaters owning approximately 80% of the combined firm.
- AYR Wellness (AYR.A: CSE) is down 44% YTD on 11.5% YTD reductions in consensus 2023 EBITDA estimates and concerns regarding the company’s sizeable 2024 debt maturities. Still, the company is progressing in building liquidity by canceling planned acquisitions and completing asset sales.
- Nearing the end of Q1, the top 3 performers YTD are: