OUR 9TH YEAR OF PROVIDING PROPRIETARY CAPITAL MARKETS INTELLIGENCE ON THE CANNABIS / HEMP / PSYCHEDELIC SECTORS

Capital Raises

Past Charts

Capital Raises

Capital Raises Summary

Each week, Viridian publishes insights and analysis on completed capital raise transactions in the prior week, focusing on all equity and debt deals. Our analysis includes:

  • Summary
  • Outlook
  • Best & Worst Perfromers

Quick Links

YTD Analysis

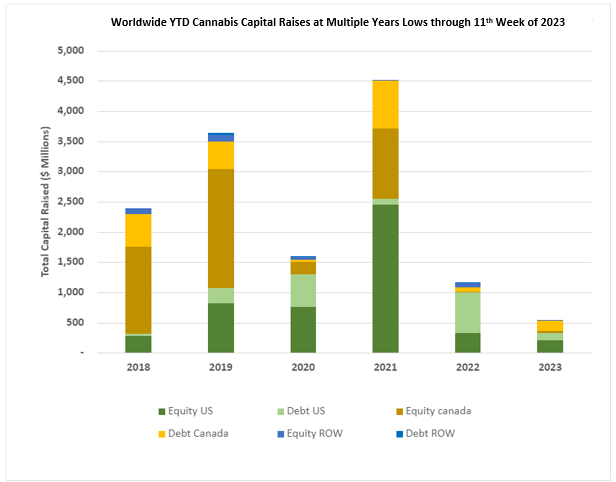
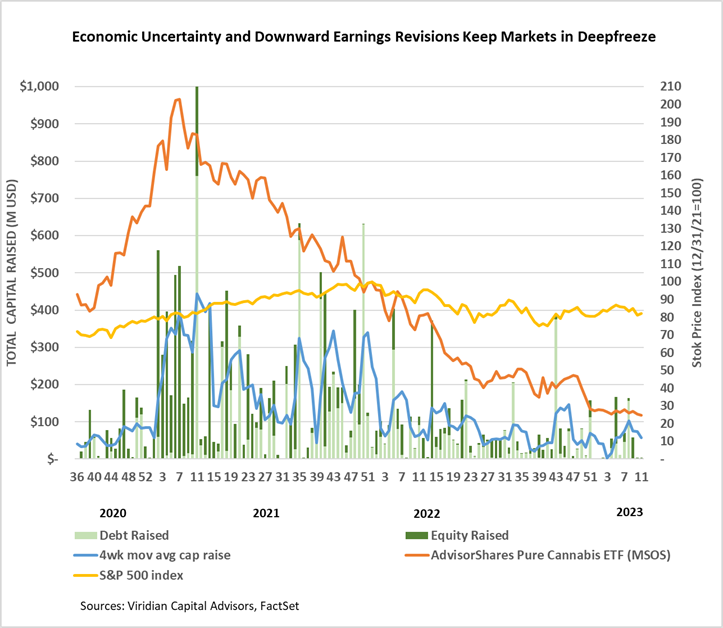
  • Cannabis capital raises are off to a multi-year low. Only $544.97M closed through the first eleven weeks of the year compared to $1,151.51M last year. Debt represents 53.1% of total capital raised.
  • Public companies have raised only 65.1% of total capital YTD, down from 79.1% last year.

Market Commentary and Outlook

           VIRIDIAN INSIGHTS

  • The banking crisis continues to unfold. This week’s surprise was the shotgun wedding of UBS and Credit Suisse. UBS appears to have gotten an excellent deal, evidenced by its stock rise since the weekend. The domestic panic isn’t over, however. First Republic Bank (FRC: NYSE) hired Lazard to search for a buyer, but buyers are apparently balking at the prospect of stepping up without a government backstop. Several major banks, including Chase, deposited funds in a show of confidence, but this has done little to quell the fear of continued deposit leakage.
    • Although this may not directly impact cannabis, a continued bank panic could be the shock that brings on the long-awaited recession.
    • The bank panic complicates the Fed’s moves against inflation. We do not believe the Fed CAN back off from at least a 25bp rate increase. We reason that reversing course after issuing such Hawkish guidance would signal to the market that the Fed believes the economy is quickly turning south. It’s hard to predict what that message would do to consumer confidence.
  • We have seen no follow on announcements regarding other MSOs following TerrAscend to the TSX. As we suggested last week, the path is not easy, and the benefits of a TSX listing may not be worth the unforeseen consequences.
  • Lowell Farm has entered into an LOI for an intriguing solution to its debt/liquidity issues. The company has approximately $23.7M of debt maturing in October 2023 and a market cap of only $7M a mix which appears to preclude a simple refinancing of the debt in the current climate. Accordingly, the company hired Canaccord in January to “view strategic options,” code for finding a buyer. No buyer came forward, and the stock has become one of the worst performers in cannabis, falling more than 60% YTD.
    • The announced plan has the company getting rid of its debt in return for 100M shares and IP for several of its top brands.
    • Essentially, this is a debt/equity swap, a tried and true debt restructuring tool. We are working on valuing the deal and will report to tracker readers as we proceed. Preliminarily we would look at the company’s $7M market cap and add $24M of debt relief to get $31M. The new share count would be approximately 191M + 100M= 291M. This math gives us a value of 100M shares of only around $10.6M. But that is not subtracting any value for the brands. The bottom line is that we are not yet clear on how this math works.

This Week Sector Focus

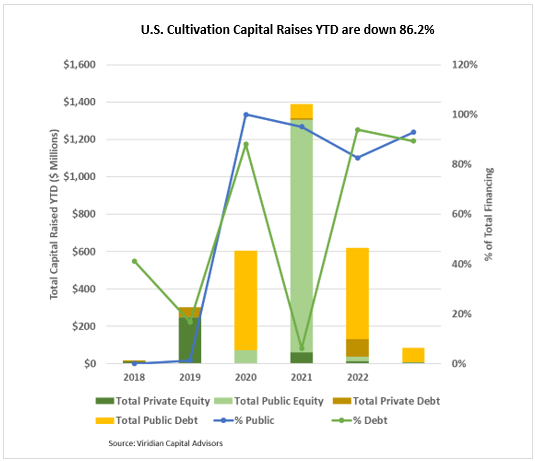
  • YTD, U.S. Cultivation & Retail sector capital raises are down 86.2% from 2022.
  • Debt is still the only game in town, accounting for 89% of all cultivation sector capital raised. The vast majority of the debt raised has been for public companies.
  • Large transactions are still absent from the market. There have been no debt or equity deals over $100M YTD.

Capital Raises vs Stock Prices

Best and Worst Stock Performers

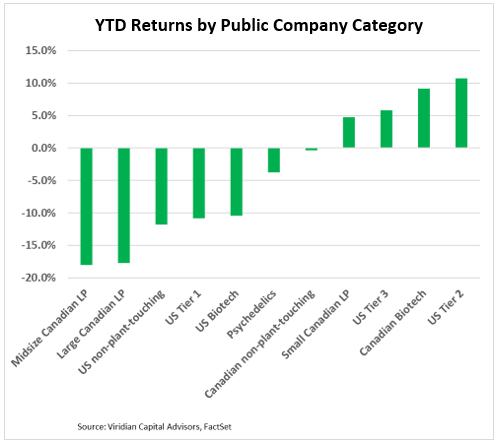
YTD Returns by Public Company Category

  • The relative ordering of YTD returns by category is mostly unchanged from last week, except for U.S. Tier 1 MSOS, which have lost two ranking notches since the previous week. The best-performing categories continue to be tier 2 and 3 U.S. MSOs.


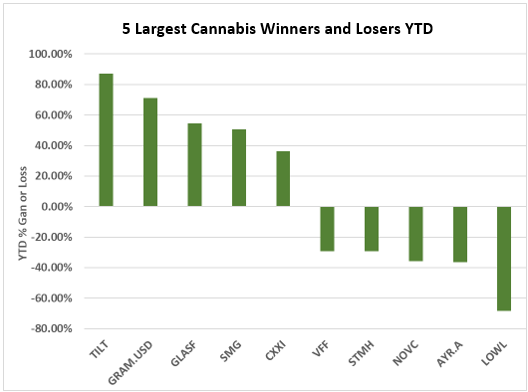
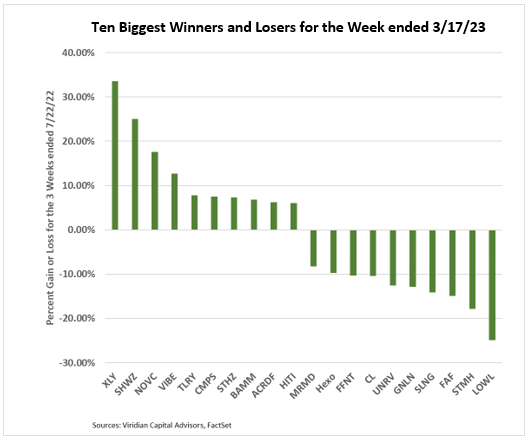
Best and Worst Performers of the last week and YTD

This Chart is Only Available to Higher Tier Memberships

Please Purchase a Basic, Premium, or Enterprise membership to see more.

This Chart is Only Available to Higher Tier Memberships

Please Purchase a Basic, Premium, or Enterprise membership to see more.

Please login to your account to view data charts.