OUR 9TH YEAR OF PROVIDING PROPRIETARY CAPITAL MARKETS INTELLIGENCE ON THE CANNABIS / HEMP / PSYCHEDELIC SECTORS
Each week, Viridian publishes insights and analysis on completed capital raise transactions in the prior week, focusing on all equity and debt deals. Our analysis includes:
- Summary
- Outlook
- Best & Worst Perfromers
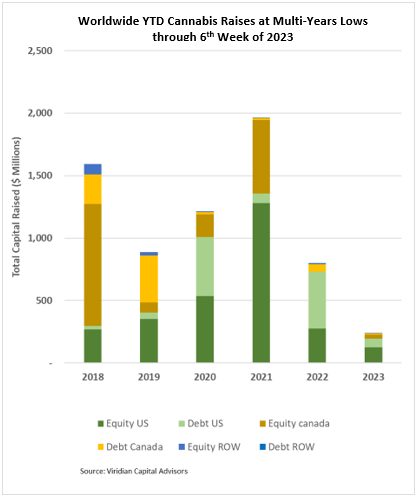
Cannabis capital raises are off to a multi-year low. Only $242.6M has closed through the first six weeks of the year compared to $798.3M last year.
- Public companies have raised only 48.5% of total capital YTD, down from 82.6% last year.
VIRIDIAN INSIGHTS
- The Viridian Chart of the Week explored the critical differences between Illiquidity and Insolvency.
- Many otherwise solid companies, like AYR (AYR.A: CSE), suffer from illiquidity. The lack of capital in the market may force them to forgo otherwise attractive investments or sell assets they otherwise would have held. The good news is that illiquidity is a problem amenable to financial engineering.
- A more difficult problem is insolvency, when the value of the company’s assets is less than its liabilities. Often this happens after a significant period of negative cash flow that depletes balance sheet reserves. Canopy Growth (CGC: Nasdaq) is not yet at this point but is heading in that direction without much sign of an operational turnaround. The company has taken many actions to stem the bleeding, but history has shown that it is difficult to shrink one’s way to profitability.
- Both flavors of distress are becoming more apparent in the cannabis landscape, and the situation is sure to worsen before it gets better.
- This week’s largest M&A deal, the purchase of Superette out of bankruptcy by SNDL, is a template for what we see as a significant uptick in distressed M&A
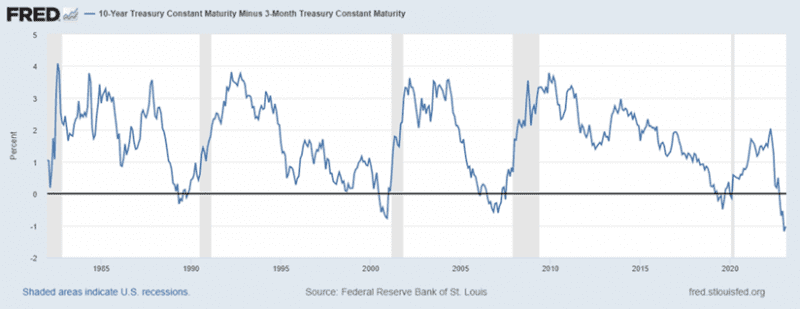
- The 3-month vs. 10-year treasury spread is still close to the most inverted since 1981, at negative 103bp. We like to watch this spread as opposed to the more commonly monitored 2yr-10yr spread for two reasons: 1) it is the measure that the Fed focuses more attention on, and 2) this measure does a better job of mirroring bank lending economics. This inversion has successfully predicted the previous five recessions, and we don’t think it will miss this time either. Investors and pundits are holding on to the notion that the Fed will pivot to a more accommodative stance, but we feel that is unlikely to happen anytime soon. Powell is quite willing to endure a recession to scrub inflationary expectations from the system.
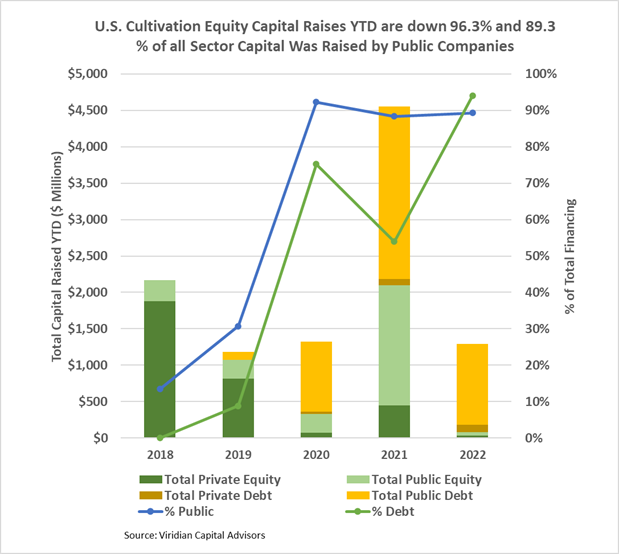
The U.S. Cultivation & Retail sector capital raises are down 71.6% YTD, but equity capital raised is down approximately 96.3%:
- Debt financing is down 50.6% YTD but accounts for about 94.0% of all capital raised; private companies raised 8.7% of it.
- 89.3% of total capital raises YTD were completed by public companies compared to 88.4% in 2021.
- In 2022, there have been no equity deals above $25M.
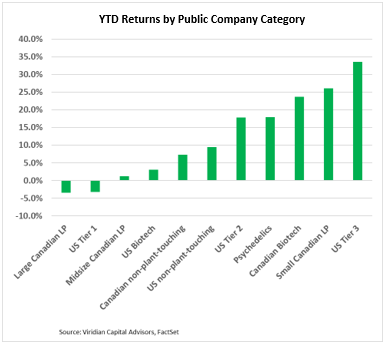
YTD Returns by Public Company Category
- Large Canadian LPs have become the worst performing category in YTD returns, driven by double-digit negative performances across the board last week after the Canopy Growth business restructuring announcement.
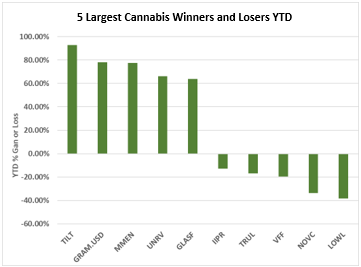
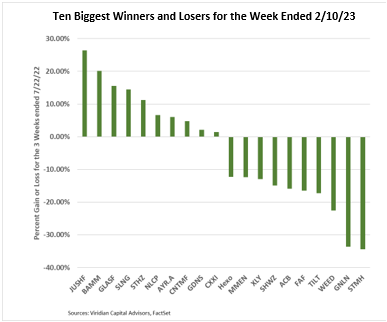
Best and Worst Performers of the last week and YTD
- Jushi (JUSHF: OTC), Body & Mind (BAMM: CSE), Slang (SLNG: CSE), and StateHouse (STHZ: CSE) are all on the top gainers list this week after appearing on the biggest loser list last week. We are frequently seeing twenty percent swings in two weeks within what is otherwise a relatively flat market.