OUR 9TH YEAR OF PROVIDING PROPRIETARY CAPITAL MARKETS INTELLIGENCE ON THE CANNABIS / HEMP / PSYCHEDELIC SECTORS
Each week, Viridian publishes insights and analysis on completed capital raise transactions in the prior week, focusing on all equity and debt deals. Our analysis includes:
- Summary
- Outlook
- Best & Worst Perfromers
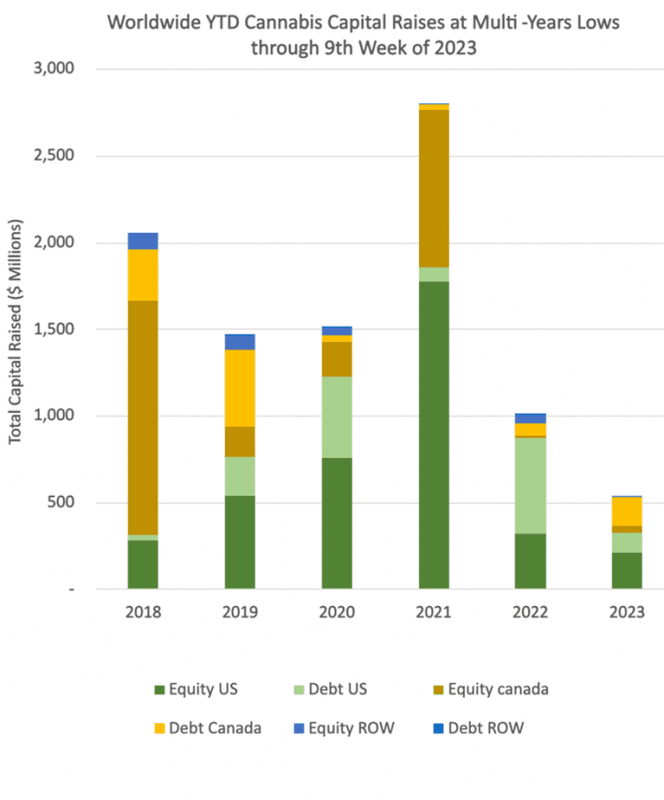
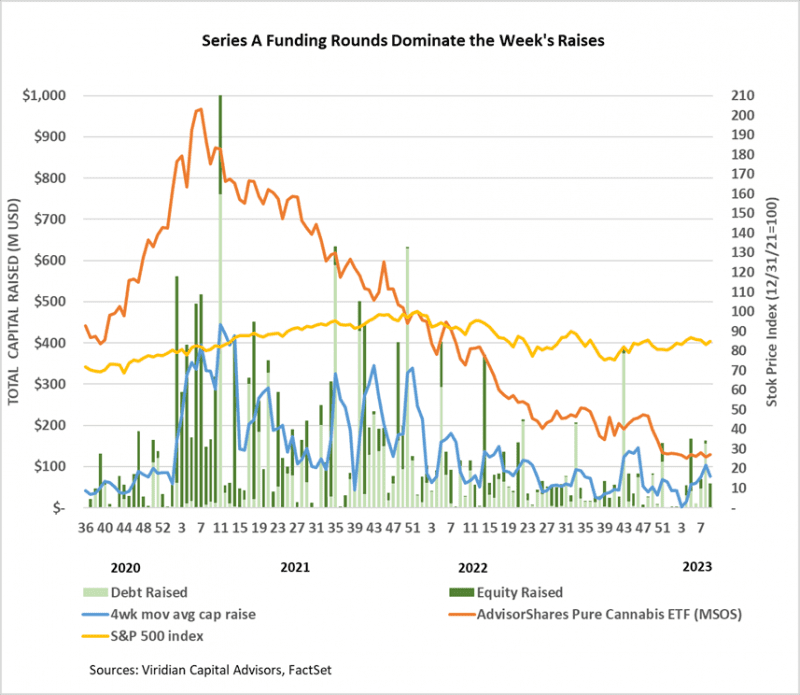
Cannabis capital raises are off to a multi-year low. Only $534.39M closed through the first nine weeks of the year compared to $1,009.01M last year. Debt represents 53.4% of total capital raised.
- Public companies have raised only 65.7% of total capital YTD, down from 81.2% last year.
VIRIDIAN INSIGHTS
- AFC Gamma (AFCG: Nasdaq) reported fourth-quarter results, which generally beat expectations, but the company also highlighted an increase in its reserves for credit losses. AFCG’s reserves now stand at approximately 5% of loans outstanding compared to 1.2% at the end of 2021. AFC’s portfolio contains 14 active loans with an average IRR of roughly 21%. On the conference call, the company stated that it only had one loan in non-accrual status. Interestingly, AFCG anticipates significantly increasing its non-cannabis loan portfolio in 2023 due to reduced opportunities to deploy capital in cannabis.
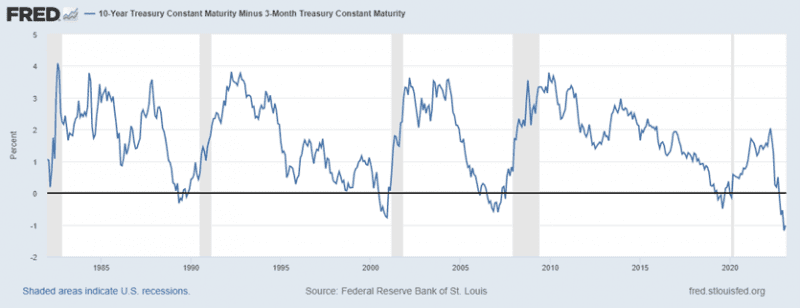
- The 3-month vs. 10-year treasury spread inversion widened about eleven basis points to negative 107bp and remains close to the most pronounced inversion since 1981. We like to watch this spread as opposed to the more commonly monitored 2yr-10yr spread for two reasons: 1) it is the measure that the Fed focuses more attention on, and 2) this measure does a better job of mirroring bank lending economics. This inversion has successfully predicted the previous five recessions, and we don’t think it will miss this time either. Today’s announcements by the Fed Chairman that rate increases will be sped up and go higher than previously expected reinforce our opinion that a near-term pivot is highly unlikely.
- Our Chart of the Week highlighted an interesting yet somewhat controversial fact: the percent decline in MSO enterprise values over the last year corresponds closely to the percentage reduction in consensus 2023 EBITDA estimates. The industry’s mantra over the previous year seemed to become “earnings don’t matter; it’s all about SAFE and legalization.” Our findings indicate that valuations are down because expected earnings are down. Go figure.
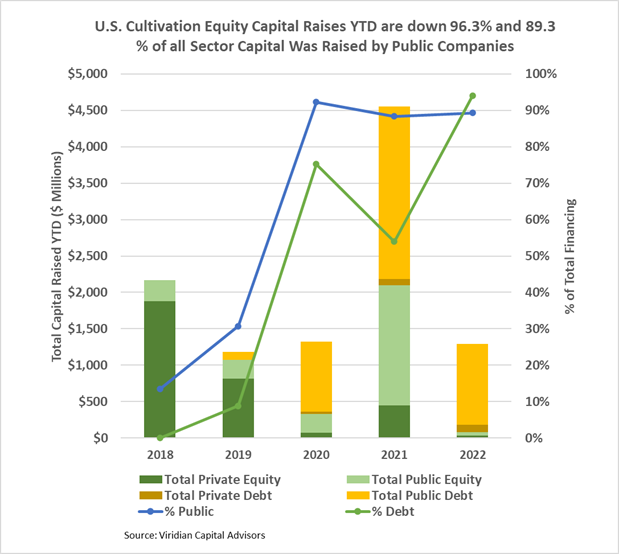
The U.S. Cultivation & Retail sector capital raises are down 71.6% YTD, but equity capital raised is down approximately 96.3%:
- Debt financing is down 50.6% YTD but accounts for about 94.0% of all capital raised; private companies raised 8.7% of it.
- 89.3% of total capital raises YTD were completed by public companies compared to 88.4% in 2021.
- In 2022, there have been no equity deals above $25M.
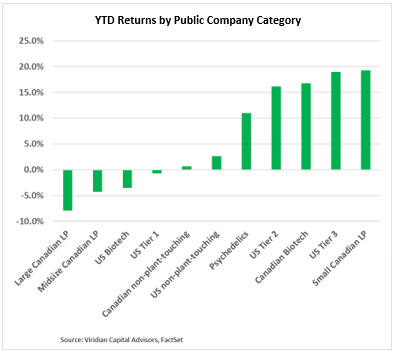
YTD Returns by Public Company Category
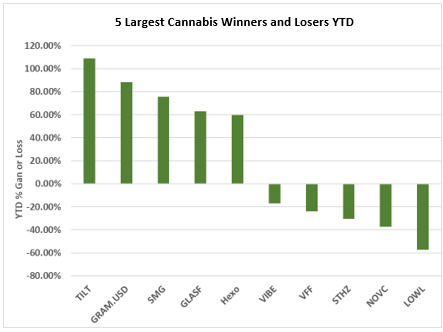
- The relative ordering of YTD returns by category is virtually unchanged from last week, with large Canadian LPs continuing to be the worst-performing category. In contrast, smaller tier 2 and 3 U.S. MSOs continue to log mid-teens YTD returns.
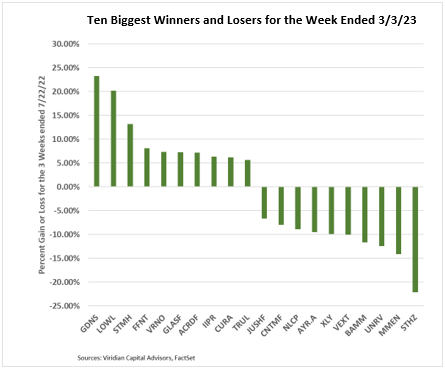
Best and Worst Performers of the last week and YTD