OUR 9TH YEAR OF PROVIDING PROPRIETARY CAPITAL MARKETS INTELLIGENCE ON THE CANNABIS / HEMP / PSYCHEDELIC SECTORS
Each week, Viridian publishes insights and analysis on completed capital raise transactions in the prior week, focusing on all equity and debt deals. Our analysis includes:
- Summary
- Outlook
- Best & Worst Perfromers
VIRIDIAN INSIGHTS
- NO GOOD DEAD GOES UNPUNISHED
- Planet 13 Holdings (PLTH: CSE)(PLNH: OTCQX) priced a unit deal today for 18.75M units for gross proceeds of approximately $11.3M
- The stock plunged by 21.5% in response!
- Why? There are several reasons, some technical and some psychological.
- The units were priced at $.6, including one share and one five-year warrant, with an exercise price of $.77 (28% premium). The warrant premium seems ok, but the five-year maturity and whole warrant per unit are unusual. We have become more used to seeing ½ warrant per unit and 2-3 years terms. The Black Scholes value of the warrant package is approximately $.146 per share, giving a net price of $.514 per share, about 28% below pre-announcement levels.
- Pricing a deal with such generous terms suggests that the deal was not easy to sell.
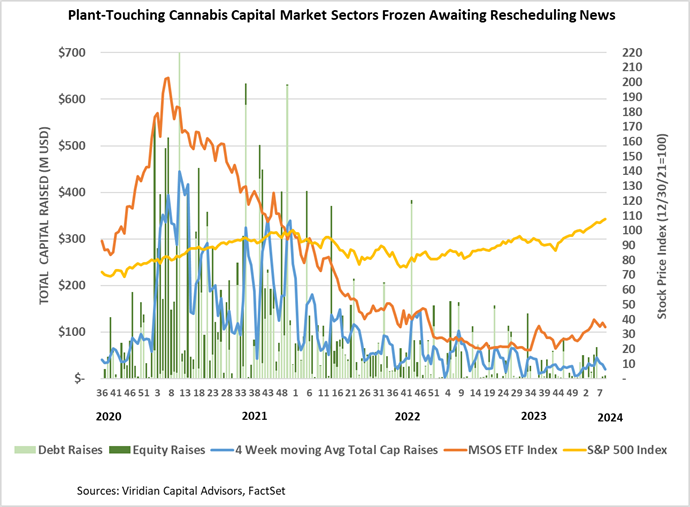
- We have been saying that the DEA rescheduling delay is freezing the cannabis equity capital market. Our reasoning is simple. Do you want to be the guy who sells shares and then finds his stock up 80% a month later after a DEA announcement? No, you certainly do not want to be that guy! But what does it say if you go ahead and do it and still have trouble selling it? Wow, that looks even worse; maybe you really needed the money for some reason (perhaps Florida?).
- To be fair, we don’t see any sign of a liquidity issue at Planet 13, and the company is certainly not overleveraged. Still, we haven’t seen much, if any, new capital coming into the space, making any significant capital raise challenging.
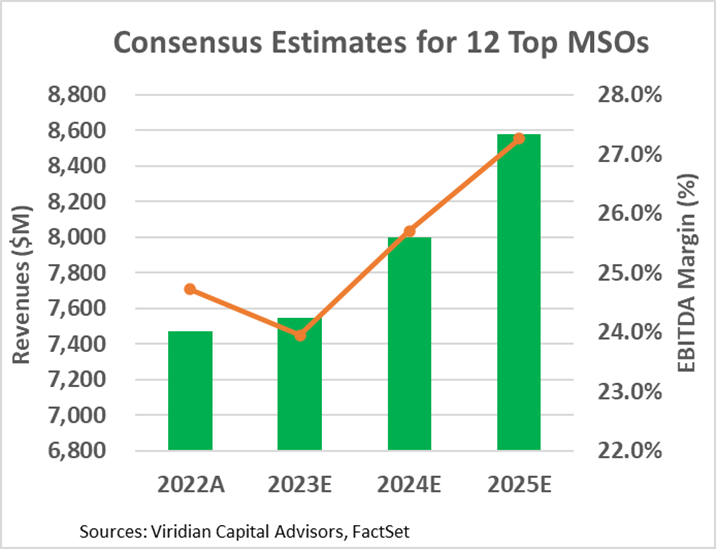
- ANALYSTS MAY BE UNDERSHOOTING ON 2024 EBITDA PROJECTIONS
- The Chart below shows consensus revenue and EBITDA margin estimates for the top twelve MSOs.
- Analysts may be too cautious with the group’s 2024 revenue growth projection of 6.0%. A year of Maryland and Ohio and near-term price stability in several key markets suggests a higher growth expectation may be in order.
- Similarly, we believe the 25.7% 2024 consensus EBITDA margins may be too low as they are only 100bp higher than the 2022 figures. The industry found religion in 2022 and 2023, stringently managing costs and tightening working capital controls. The industry is poised to be more efficient and profitable as growth returns.
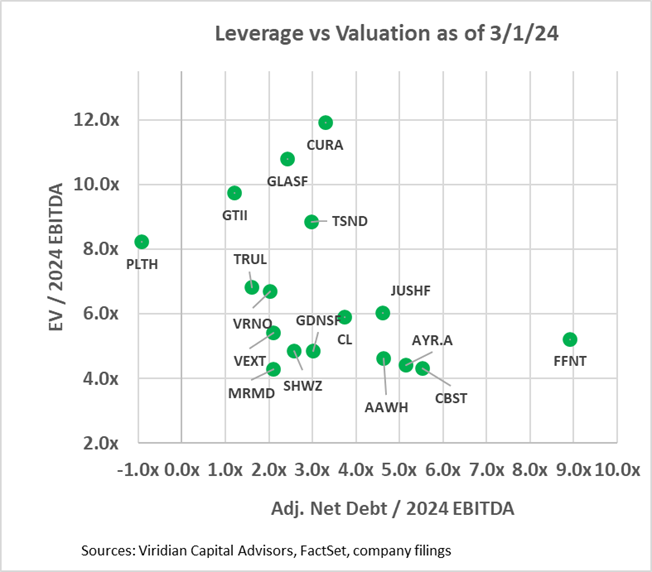
- A Careful Look at EBITDA and Market leverage and a liquidity review suggest likely courses of action for some overleveraged MSOs.
- The two graphs below show the Enterprise value to 2024 EBITDA multiples against two leverage measures. In the first graph, we have calculated an Adjusted Net Debt/ 2024 EBITDA figure by adding any accrued taxes over 90 days of tax expense to debt before subtracting cash to arrive at Adjusted Net Debt. We would expect any regular company to have accrued taxes equal to their last quarterly tax expense and consider that a standard working capital item. Several companies on the Chart have far greater than 90 days of accrued taxes, and we consider the excess to be debt. Verano’s excess tax liabilities equal nearly 40% of its debt. Other companies with relatively high imputed tax debt include Curaleaf (CURA: CSE) and 4Front (FFNT: CSE) at 19%, and Terrascend (TSND: TSX) at 17%.
- A comparison of the two top graphs is instructive. Some companies like TerrAscend, Goodness Growth, and Curaleaf appear to be directly on or slightly over 3x adjusted net debt to EBITDA, which we view as the demarcation line of long-term sustainability.
- TerrAscend and Curaleaf have relatively low total liabilities to market cap because the market is valuing their stocks at such high multiples. These companies should issue equity at these high multiples to directly fund debt reduction or use equity to purchase another company and increase EBITDA. An acquisition of one of the companies trading at much lower EBITDA multiples is likely to be accretive.
- Goodness Growth is in precisely the opposite situation. It is not as levered as Curaleaf on an adjusted Debt to EBITDA basis. Still, its stock is trading at such low multiples that the prospect of issuing equity to reduce debt seems unlikely. Goodness Growth will likely have to sell assets or sell itself to work out of its overleveraged situation.
- Jushi, AYR, Cannabist, and 4Front appear significantly overleveraged in both an EBITDA and Market Cap sense. However, each has some element of optionality that might prove 2024 EBITDA estimates too conservative. For Jushi, it is Pennsylvania and Virginia. For AYR, it is Florida. Cannabist is in Ohio, New York, Pennsylvania, and Florida. 4Front is levered to Illinois.
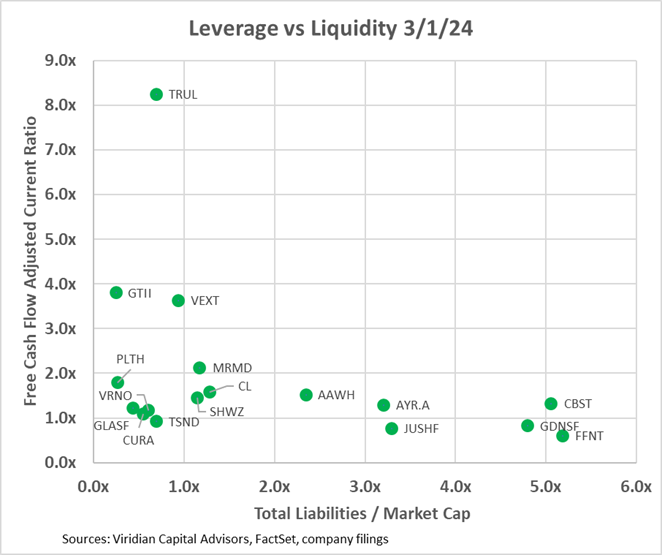
- The third graph shows that AYR and Cannabist have better liquidity than Jushi or 4Front and are less likely to need to push a highly dilutive equity deal or expensive debt deal into the market.
- Looking at leverage in two ways and having a comprehensive measure of liquidity can give investors a good idea of possible scenarios for today’s overleveraged companies.

-
-
- WERE THE APPARENT GAINS IN CANNABIS STOCK LIQUIDITY HEAD-FAKES?
- Last week, we reported on the tremendous gains in MSO stock liquidity by comparing the average daily trading volume in key MSOs from February 2024 to February 2023.
- The Chart below shows a different view of the data and presents a far less pleasant conclusion. After several unusually strong trading weeks in early February, primarily created by false rumors of imminent rescheduling announcements and the portfolio rebalancing by the MJUS ETF, trading volume has dropped significantly in the last two weeks. More telling is the increases in the Days to Trade Market Cap (DTTMC) series, which eponymously depicts the number of days it would take to trade the market cap of a stock or group of stocks. Its most recent reading of 508 days is above the downward trend line shown on the graph. What happened? The reality is that very little new institutional capital has come into the cannabis market. The investors are still the same. Will rescheduling change this? Perhaps, but not directly. Cannabis under Schedule 3 will still not be federally illegal, and it will probably take a veritable trifecta of rescheduling, a SAFER Act (hopefully expanded to include capital markets actors like investment banks and large institutional investors), and a Garland memo to ensure open access to large institutions. Still, at the margin, the cash-flow-enhancing impacts of Schedule 3 will make cannabis more investible and attract more capital.
- WERE THE APPARENT GAINS IN CANNABIS STOCK LIQUIDITY HEAD-FAKES?
-
-
-
- GIVING CREDIT WHERE CREDIT IS DUE
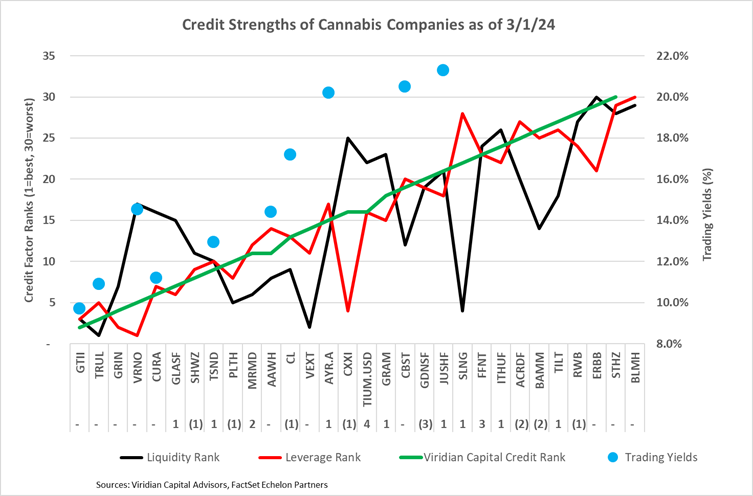
- The Chart below shows our updated 3/1/24 credit rankings for the 30 U.S. cannabis companies with over $5M market cap. The number below the ticker symbol indicates the change in credit ranking since last week, where a negative number suggests credit deterioration, while a positive indicates improvement.
- The blue squares show the offered-side trading yields for each company. Trading yields have declined significantly since the HHS rescheduling announcement.
- Trulieve debt traded up by around a point this week, correctly reacting to the earnings beat and strong cash flow generation. AYR, Cannabist, and Jushi are now trading at yields consistent with our relative credit rankings.
- GIVING CREDIT WHERE CREDIT IS DUE
-
- THERE IS STILL CONSIDERABLE UPSIDE POTENTIAL
- The Chart below shows enterprise to next-twelve-month valuation multiples now compared to previous times when positive regulatory/legislative news hit.
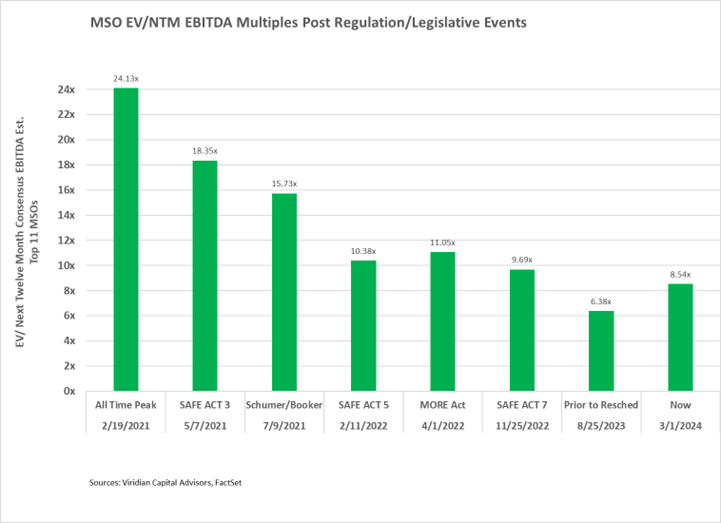
- The Chart demonstrates a healthy investor skepticism regarding positive regulatory/legislative events in Washington, D.C.
- EV/NTM EBITDA Multiples are now 17.7% below the levels after the 5th SAFE Act passage in the House in February 2022. Still, the rescheduling news is more significant as it dramatically impacts cash flows. If valuations multiples rose to where they were after the announcement of the Schumer-Booker bill, the incremental gains would equal 84.2%. We view a DEA announcement ratifying the HHS recommendation to be much more significant than introducing the Schumer-Booker bill, which most observers viewed as DOA and had no immediate impact on operator cash flows. Accordingly, we believe there is considerably more runway for price increases, perhaps reaching the 5/7/21 multiples of 18.35x, producing 114.8% returns from current levels.
- Cannabis equities (as measured by the MSOS ETF) were down 7.80% for the week despite strong revenue and EBITDA reports from GTI, Trulieve, and Verano.
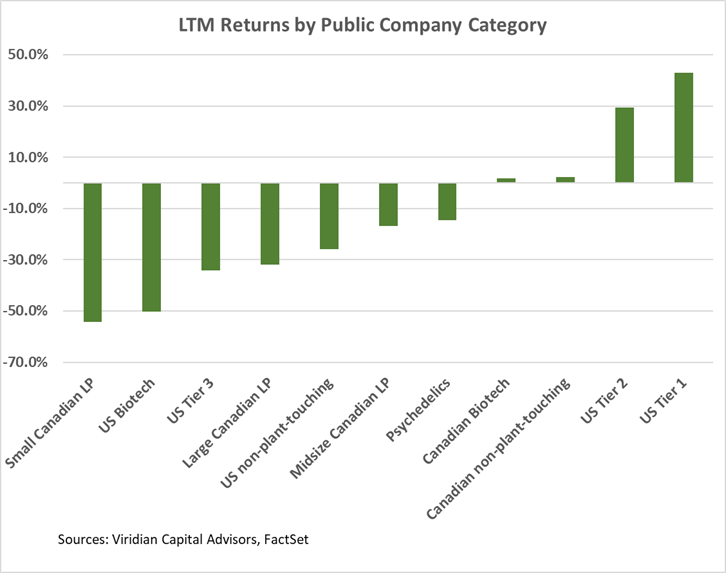
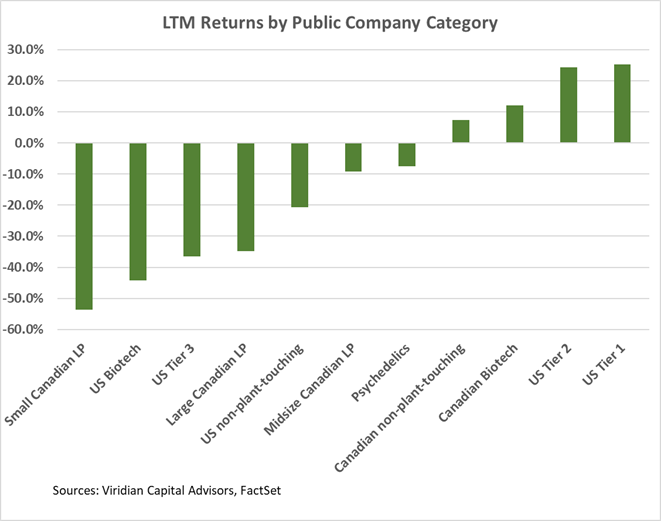
Trailing 52-Week Returns by Public Company Category:
- U.S. Tier One MSOs continue performing best out of our eleven categories. Still, the gap between Tier One and Tier Two MSOs has narrowed, as demonstrated by the Viridian Valuation Gap chart in the M&A section of the tracker.
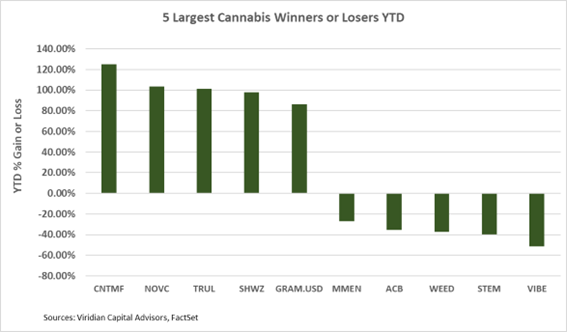
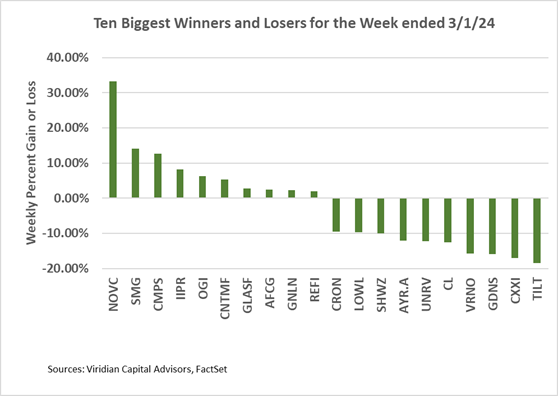
Best and Worst Performers of the last week and YTD:
- Gainers included several key cannabis lenders and sales leaseback providers, including IIPR, AFC Gamma, and Chicago Atlantic. Proximate causes include the strong earnings report by IIPR and the debt accordion increase and maturity extension by Chicago Atlantic. Notably missing from the gainers list were GTI and Trulieve, which both had significant EBITDA beats this week
- Losers include names levered to a rescheduling announcement, including AYR, Cannabist, Cresco, Jushi, and Goodness Growth.