OUR 9TH YEAR OF PROVIDING PROPRIETARY CAPITAL MARKETS INTELLIGENCE ON THE CANNABIS / HEMP / PSYCHEDELIC SECTORS
Each week, Viridian publishes insights and analysis on completed capital raise transactions in the prior week, focusing on all equity and debt deals. Our analysis includes:
- Summary
- Outlook
- Best & Worst Perfromers
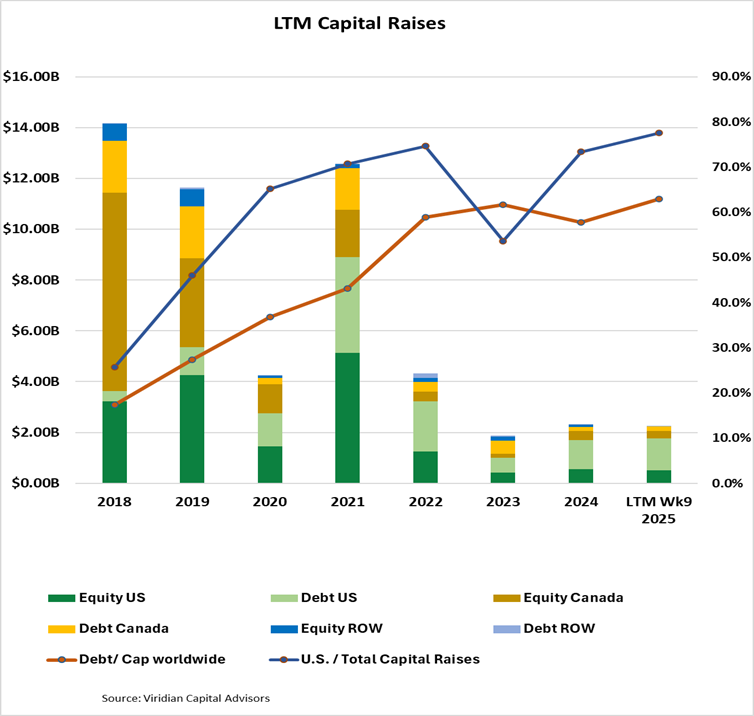
- LTM capital raises totaled $2.27B, down -2.2% from the same period in 2024. Debt as a percentage of capital raised on a worldwide basis was 62.9%, compared to 57.8% last year. U.S. raises LTM accounted for 77.6% of total funds, up from 53.6% at the same point in 2023. Raises from outside Canada and the U.S. represented 1.35% of the total funds raised, falling short of the average of 5.33% in the six previous years.
- Raises by public companies accounted for 80.17% of total raises in the LTM period, the highest since 2021.
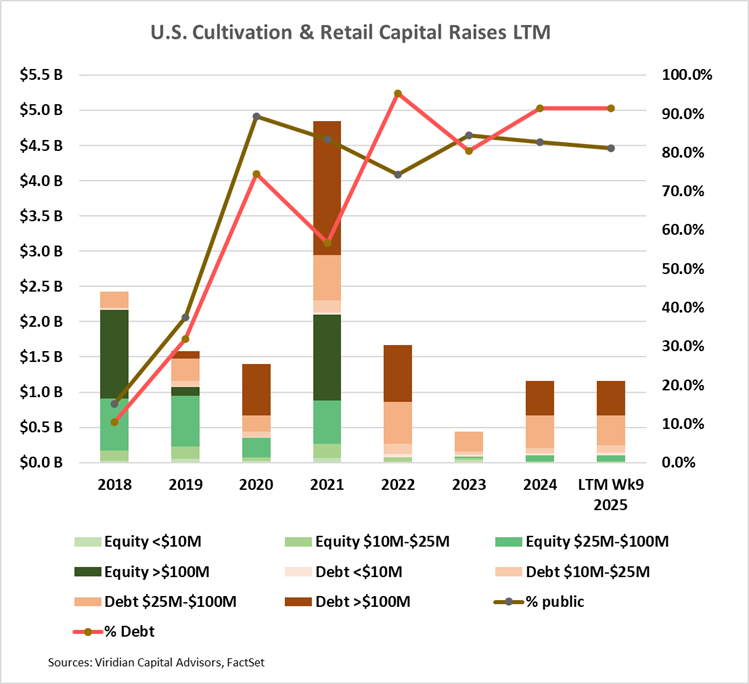
- Cultivation and retail sector capital raises were $1.16B for the LTM period tied with 2024, which in turn was up 167% from 2023.
- Debt accounts for 91.4% of funds raised in the LTM period. Large debt issues (>$100M) represented 41.9% of capital raised compared to zero in 2023.
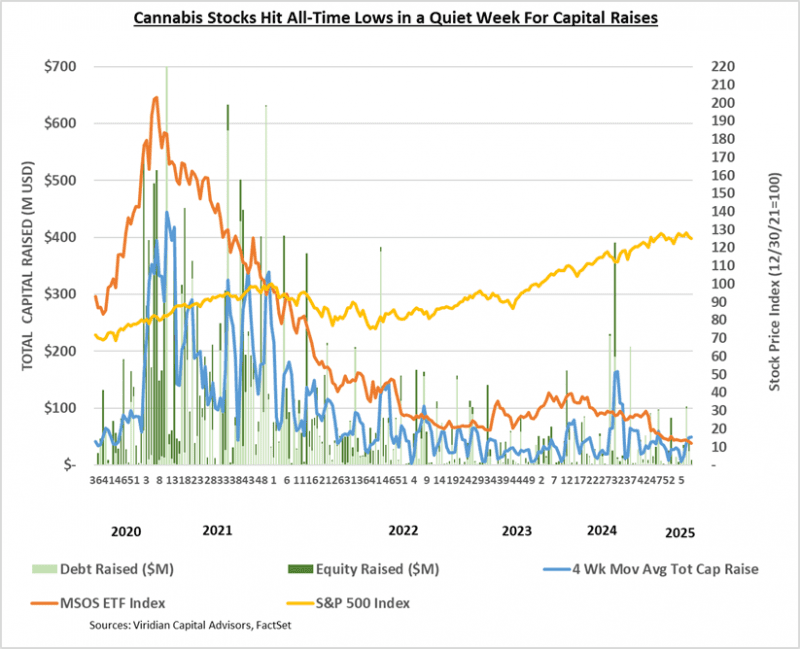
- Cannabis equity prices (as measured by the MSOS ETF) declined 7.5% for the week, finishing at all-time lows.

VIRIDIAN INSIGHTS
-
- FOUR OF THE LARGEST MSOS HAVE REPORTED 4TH QTR EARNINGS, AND THE RESULTS WERE MIXED: GTI AND TRULIEVE BEAT ESTIMATES WHILE VERANO AND CURALEAF MISSED.

-
-
- A PREVIEW OF 4TH QTR. 2024 EARNINGS RELEASES: REVENUE ARE EXPECTED TO BE DOWN AND SO ARE MARGINS
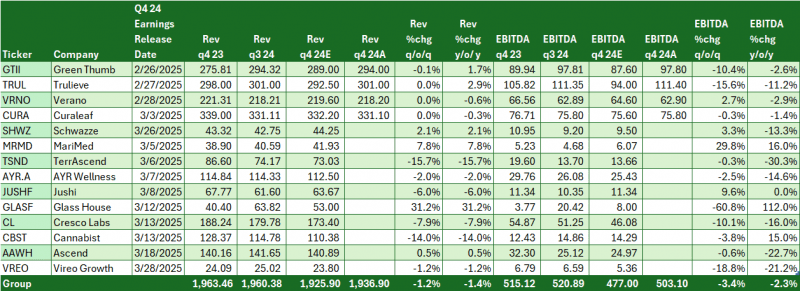
- The chart below, arranged in order of release date, shows consensus estimates for Q4:24 earnings compared to the previous quarter and the year-earlier quarter for fourteen of the most significant MSOs. For those who have already reported, we show actuals.
- A PREVIEW OF 4TH QTR. 2024 EARNINGS RELEASES: REVENUE ARE EXPECTED TO BE DOWN AND SO ARE MARGINS
-
-
- An earlier Viridian Chart of the Week showed that most of the forecasted EBITDA shortfalls are due to expectations of lower EBITDA margins as opposed to lower revenues.
- Besides revenues and EBITDA, what else should investors focus on in the upcoming releases?
- We are generally more interested in the magnitude of estimate revisions than in the magnitude of revenue or EBITDA misses or beats.
- Cash and Net Debt. The capital markets environment has not gotten easier, and maintaining a good liquidity position and reducing debt are still key. The Viridian Chart of the Week focused on cash flow from operations, which for ten of the twelve companies reviewed, is projected to be positive for Q424. Will this result in balance sheet improvement?
- Cash Flow From Operations. For the first nine months of 2024, cash flow was profoundly boosted by increases in “uncertain tax liabilities,” the catchy name for 280e taxes that were expenses through the income statement but not paid. We will pay particular attention to how much these liabilities increased at year-end and any signals from the companies regarding any changes in their tax strategies.
- Will companies flesh out new strategies for attacking the hemp beverage market? Curaleaf, GTI, and now Trulieve have jumped in, but we expect more to follow.
- Will companies directly address their strategy regarding 2026 debt maturities?
- TRULIEVE JUMPS ON THE HEMP THC BEVERAGE BANDWAGON.
- On February 26, Trulieve announced the launch of Onward, a Farm Bill compliant, non-alcoholic THC beverage that will be sold online and through Total Wine locations in Florida.
- The beverage segment of the market is perfect for entry by MSOs, and we predict that the other tier 1s will join the trend.
- The key is that .3% THC by weight ends up being almost limitless in the context of a 12-ounce beverage can. We calculate that one could add nearly 1000mg of THC to the can and still be under the limit.
- Beverages are problematic to distribute through the dispensary channel, which is not well situated to store, display, or refrigerate these items.
- The availability of the DTC distribution channel seals the deal, and the ability to avoid 280e taxes is further icing on the cake.
- The barn door is wide open, and we do not see any way to close it.
- CANNABIST ANNOUNCED A BOLD DEBT RESTRUCTURING PLAN THAT FEELS LIKE DEJA-VU
- Cannabist’s announced debt restructuring plan looks eerily similar to the one that AYR executed at the beginning of 2024: The company is giving up around 25% of its equity to extend debt maturities to 2028 with two six-month extensions. Cannabis, as AYR did, is seeking court approval under a plan of arrangement pursuant to the Canada Business Corporations Act (CBCA). The exact level of approval required is not clear, but usually, it is 2/3 of holders. The importance of using this device is that, if successful, there will be no “hold-outs” who elect to keep their existing bonds.
- Holders of existing notes will receive dollar-for-dollar exchanges into similar coupons with longer maturities. Holders who commit to the plan early will also receive a pro-rata share of a $1.5M early consent fee.
- Like AYR, the company is not extinguishing any debt in the plan. It will remain arguably overleveraged, but the stakes are survival and this plan gives the company significant time to improve its profitability and make other operating and capital structure moves.
- We applaud Cannabis management for making an early move to address a worrisome upcoming series of debt maturities. We had ranked the company’s situation as one of the most perilous (along with AYR)
- Our option theoretic methodology previously took the Cannabist total-liabilities-to-market-cap of around 26.9x and back solved through the option model to find the implication that the market believed the value of Cannabist’s assets was only around 65% of its liabilities. Its stock was, therefore, trading as an out-of-the-money option. One critical assumption we used was that the maturity of the equity option was only 2 years, as that was when the proverbial sh**t was due to hit the fan from the company’s debt maturities.
- But what if we now took that same asset value and went the other way? All things being equal (i.e., no change in assets or liabilities), except now the company has until at least the end of 2028 to fix itself. What would that mean for the stock price, total liabilities to market cap, and perceived credit risk?
- Our calculations show that the completion of the restructuring could have a dramatic impact on the stock. In fact, we think it could go up by a factor of 2.5x to around $.14 per share! Total liabilities to market cap would improve from 26.9x to 10.7x, still a stressed credit but not disastrous. So far, the market has not seen the logic of our analysis, which we maintain to be theoretically sound.
- GAUGING THE RISK OF THE 2026 DEBT MATURITY BUBBLE
- Much has been made of the upcoming wave of cannabis debt maturities in 2026. The sheer size is undoubtedly intimidating. The companies pictured on the graph below collectively have about $2.6B of debt maturing in 2026. (IAnthus maturities are actually in 6/27, but close enough!). Putting that figure into perspective, $2.6B is greater than the total capital raised for the cultivation & retail sector for any year since 2018 except for 2021.
- Viridian is generally more constructive about the issue than most other industry observers. We observe that in the high-yield bond market, it is virtually never the case that debt is paid off in cash. It is generally refinanced, OR the company is forced to restructure. Obviously, given the lack of prepack bankruptcy (or any bankruptcy for that matter), restructuring is rightfully a prospect to be feared in cannabis.
- So, how do we gauge the risk of something going wrong in 2026? Refinancing risk is a peculiar mixture of market psychology and financial realities.
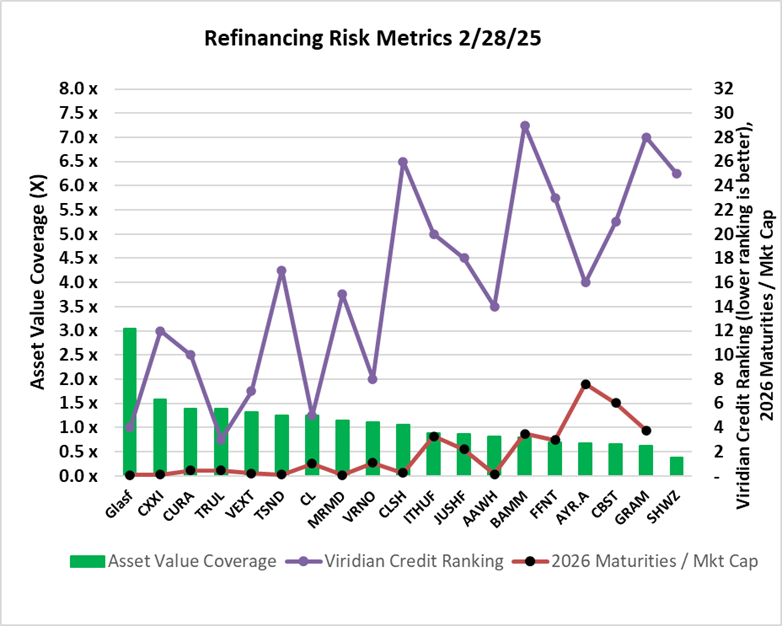
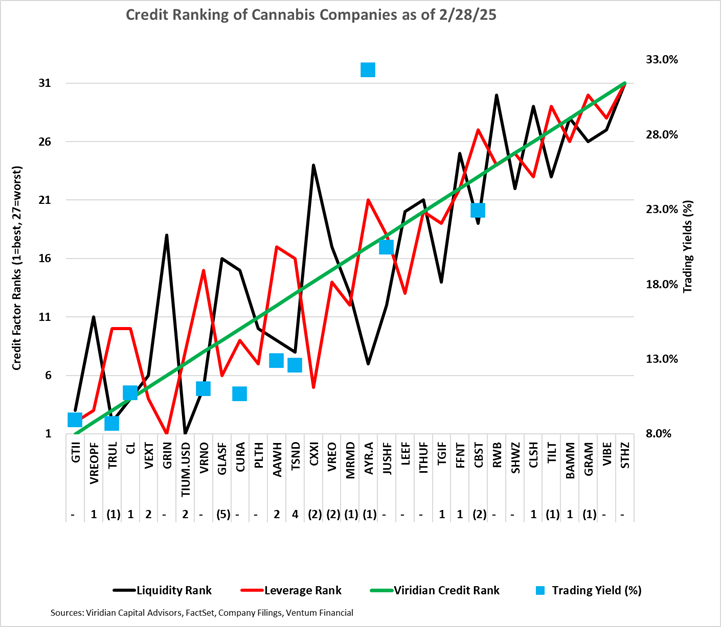
- Successful completion of the Cannabist plan discussed above should have a positive impact on the market psychology regarding the other troublesome maturities. The graph below shows three relevant data points:
- The green bars show the 2/28/25 market-implied asset coverage of total liabilities. We arrive at this by looking at the equity as a call option on the asset value of the firm, with a strike price of its liabilities, and with assumed maturities (2026) as well as volatility assumptions (40%) and risk-free rate (4.25%). This gives us all of the elements of the Black-Scholes option pricing formula except for the current asset value. By iterating the solution of the BS model, we can find the market’s assumption for asset value. The importance of this data point should be obvious. For companies with under 1x asset coverage of liabilities, debt providers are genuinely making an equity bet. They do not have adequate asset value coverage to fall back upon.
- The purple line represents the Viridian Capital credit ranking, which takes into account four key credit factors: Liquidity, Leverage, Profitability, and Size. Refinancing will be more difficult for weaker credits (higher numbers). Companies with ranks of under 16 are in the top half of the Viridian-ranked universe of credits.
- The red line represents the multiple of market cap that 2026 debt maturities represent. Clearly, the larger the debt maturities relative to the market cap, the more difficult we would expect refinancing to be. The seven companies from ITHUF to the right side of this graph represent high risk. They have less than 1x asset value coverage, poor Viridian Credit Ranks, and maturing debt that is a multiple of market cap. Companies in this position represent approximately $867M of the maturing debt. Conversely, the five companies on the left-hand side of the graph represent low refinancing risk. They have solid asset coverage, strong Viridian Credit Ranks, and maturing debt that is less than 1x market cap. These companies represent $1.6B of the $2.6B total (62%), and we believe they should all be able to refinance their maturities without undue pain.
-
- PHARMACAN, ANOTHER EARLY TEST OF THE REFINANCING CLIMATE
- One of the critical conditions of the agreement between Pharmacann and IIPR is that Pharmacann must be able to refinance its estimated $125M of 12% of senior secured notes of 6/30/25. Pharmacann will be the first test of a problematic refinancing. We expect the company to need a pretty hefty amount of equity kickers in terms of shares or warrants to convince bondholders to extend/refinance this debt. One unknown that may be material is the amount of new equity that Pharmacann will receive from existing investors. The equity raise is a mandated feature of the IIPR settlement, but the amount was not disclosed.
- Pharmacann is private and is basically flying under the radar which is trained so intensely on companies like AYR who have significant debt maturities in 2026.
- Pharmacann bonds do occasionally trade, however, and currently, they are quoted 70 bid / 80 offer, according to Ventum Capital. This distressed pricing demonstrates significant market doubt that the company will be able to refinance this debt. If Pharmacann fails to refinance the debt, the agreements, waivers, etc, with IIPR are eliminated, and the company will be in default on substantially all of its leases.
- PHARMACAN, ANOTHER EARLY TEST OF THE REFINANCING CLIMATE
-
- A PERPLEXING QUANDRY: IF TRUMP IS TRULY PRO-CANNABIS, WHY HAS HE REMAINED TOTALLY SILENT ON THE ISSUE, AND WHY IS HE STACKING THE RELEVANT AGENCIES WITH ANTI-CANNABIS HARDLINERS?
- If the appointment of an anti-cannabis former DEA agent as acting head of the DEA wasn’t bad enough…
- Trump named Terrance Cole as the permanent DEA head, and he doesn’t appear to be any more favorable for cannabis.
- Most recently, he nominated former U.S. Attorney and current GOP Senator from West Virginia Mike Stewart as the lead attorney at HHS. Stewart is vocally anti-cannabis, calling current products “genetically engineered” “gateway drugs” that lead to greater misuse of opioids! Wow! How many discredited concepts can you string together?
- Meanwhile, a few weeks ago, Republican Senators Lankford of Oklahoma and Ricketts of Nebraska introduced the “No Deductions for Marijuana Business Act,” which would prevent cannabis businesses from deducting standard business expenses such as payroll and rent even if cannabis is rescheduled to S3! A similar bill was introduced in the House last week.
- The one pro-cannabis individual in sight, Robert Kennedy, the new head of HHS, appears to have been muzzled. He stated in his confirmation hearings that he would defer to the DEA on matters relating to rescheduling. Perhaps that was simply what he thought he had to say to get confirmed, but it certainly doesn’t make us feel more comfortable.
- In addition, Trump’s new attorney general, Pam Bondi, has remained conspicuously silent regarding her position on cannabis reform.
- We never expected rapid action, and in fact, in a recent column, we explained why very few people outside the cannabis industry really care about cannabis reform. Still, we have held on to the hope that Trump will be a more effective cannabis reform president than his predecessors. (yes, we know that is a low hurdle). However, Trump’s complete and utter silence since the election regarding cannabis reform is causing everyone, including us, considerable angst.
- We understand that the war on Fentanyl and the Mexican cartels necessitates a “hard on drugs” stance, but at this point, we are unsure what it will take to get Trump’s attention to follow through on his cannabis pledges.
- If Trump makes it clear that he wants rescheduling and/or SAFER to go through, it is likely that these initiatives will proceed. But, absent a personal push from him, we are not sure that even a re-emboldened Robert Kennedy will be enough. Perhaps a DOGE push to save the substantial direct and indirect costs of anti-cannabis legislation and regulation will be the industry’s best bet.
- A PERPLEXING QUANDRY: IF TRUMP IS TRULY PRO-CANNABIS, WHY HAS HE REMAINED TOTALLY SILENT ON THE ISSUE, AND WHY IS HE STACKING THE RELEVANT AGENCIES WITH ANTI-CANNABIS HARDLINERS?
-
- MSOs ARE TRADING AT HIGHER VALUATION MULTIPLES AND HAVE HIGHER LEVERAGE THAN STANDARD MEASURES INDICATE! MSO VALUATION AND FINANCIAL FLEXIBILITY DEPICTED BY FOUR GRAPHS.
- The four graphs below seek to map the financial options available to eighteen of the largest MSOs based on their Valuation, Leverage, and Liquidity. We have updated our measures to look at 2025 EBITDAR estimates as we believe most investors are now looking to these values in their valuations.
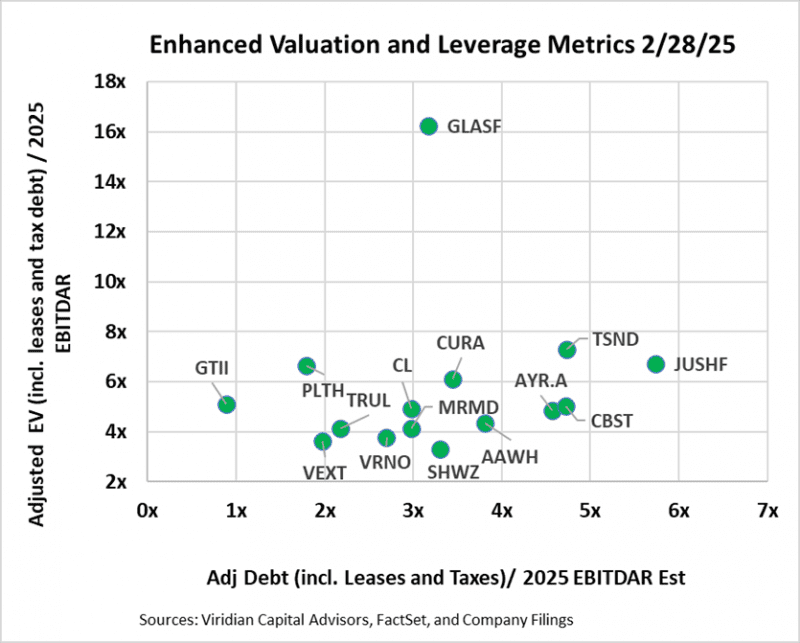
- The first two graphs present different versions of EV/EBITDA on the vertical axis and Debt/EBITDA on the horizontal axis.
- The first graph presents our latest view of the most appropriate valuation and financial statement-based leverage metrics: Adjusted EV / 2025 EBITDAR and Adjusted net debt / 2025 EBITDAR. In calculating Adjusted Net Debt, we make several key assumptions: 1) Leases that are included on the balance sheet are considered debt. We view most leases in the cannabis space as equivalents to equipment loans or mortgage loans. While it is true that a lease default does not necessarily trigger a cascade of events leading to bankruptcy, the distinction is often meaningless in cannabis due to the mission-critical nature of many long-term leases and the absence of bankruptcy protection in cannabis. 2) We consider any accrued taxes (including uncertain tax liability accounts listed as long-term liabilities) in excess of the most recent quarterly tax expense to be debt. Our calculation of enterprise value is now market cap plus debt plus leases plus tax debt minus cash. We now use EBITDAR rather than EBITDA since lease expense is taken out prior to EBITDA.
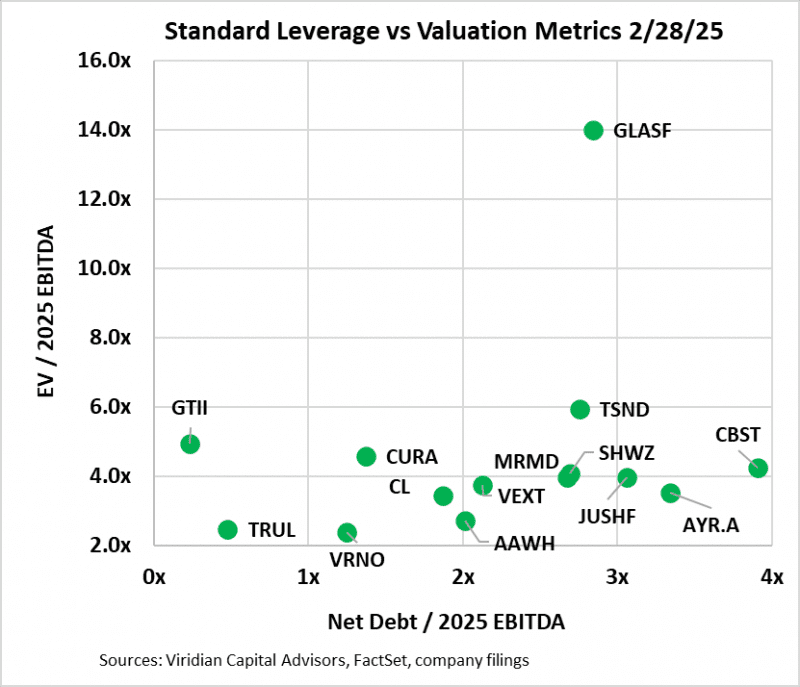
- The second graph utilizes EBITDA and employs the traditional calculations of both debt and enterprise values, leaving out leases and taxes.
- Our adoption of new metrics tends to make the companies look less cheap and more leveraged.
- Surprisingly, nine of the companies on the enhanced metric chart are still above 3x leverage, which we have identified as the boundary of sustainability in a 280e environment. Four companies now exceed 4x leverage, which we believe will be close to the maximum sustainable post 280e.
- Jushi and TerrAscend appear as leverage outliers using the new metrics relative to AYR and Cannabist, which seemed more leveraged using standard measures.
- TerrAscend and, particularly, Glass House are valuation outliers. We have been positive on Glass House for quite a while, but the multiple spread to the nearest competitor is straining our resolve. We note GLASF’s $25M at the market equity issuance facility as another factor likely to restrain price appreciation.
- MSOs ARE TRADING AT HIGHER VALUATION MULTIPLES AND HAVE HIGHER LEVERAGE THAN STANDARD MEASURES INDICATE! MSO VALUATION AND FINANCIAL FLEXIBILITY DEPICTED BY FOUR GRAPHS.
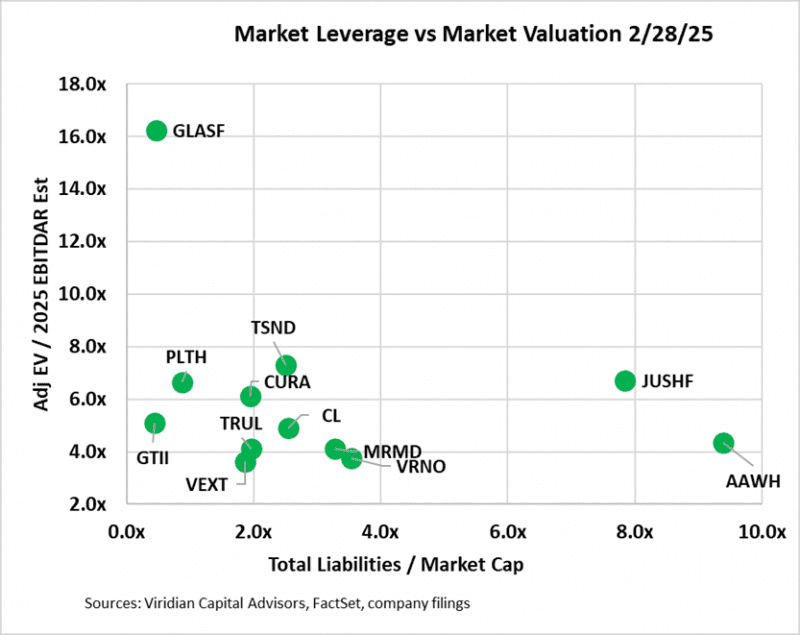
- The third graph looks at leverage through the lens of total liabilities to market cap. We believe this is the single best measure of leverage because it is a direct reflection of the market’s assessment of the value of a company’s assets in excess of its liabilities and is sensitive to changes in market perception of a company’s future.
- On the bottom left are companies with Adj EV/2025 EBITDAR of under 7x and total liabilities to market cap under 2x. The group includes Vext, GTI, Trulieve, and Curaleaf. Companies in this quadrant are right to consider stock repurchases or using cash in acquisitions. They can afford some additional debt and can take advantage of the ongoing dislocation in equity prices.
- In the middle, between 2x and 5x total liabilities/market cap, we see Verano, Cresco, and MariMed. Verano and Cresco both have significant 2026 maturities, but we do not believe either is likely to have difficulties refinancing their debt.
- On the right lies Jushi and Ascend, both between 6x and 10x.
- AYR, 4Front, Cannabist, and Schwazze are now off the chart to the right, signaling profound credit risk. Our recent work using option modeling of equity prices showed that the market believes each of these companies has significantly less asset value than liabilities.
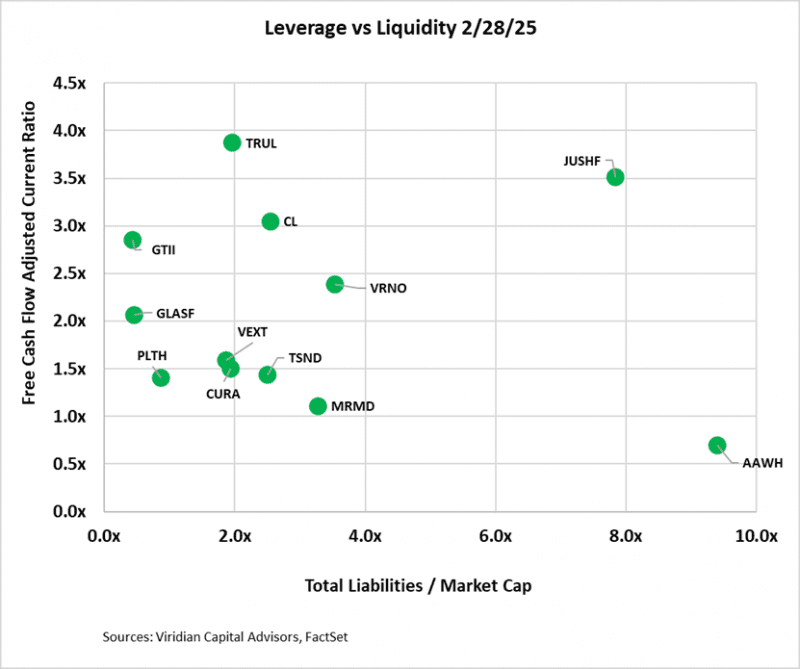
- The fourth graph introduces the free cash flow adjusted current ratio liquidity measure into the mix. Companies with less than 1x on this measure will likely have to raise capital next year. Surprisingly, eight of the companies fall into this bucket (including Schwazze, not pictured).
- The bottom left group, including Curaleaf, Verano, and TerrAscend, has low leverage but is below the critical 1x liquidity level. Companies in this range should consider taking advantage of the robust debt market to bolster liquidity.
- On the top left, we find companies with adequate liquidity and low market leverage, including both GTI and Planet 13.
- Companies in the lower middle-to-right generally have constrained liquidity and high leverage, a potentially dangerous combination in a capital-constrained environment. Aside from Curaleaf, Verano, and TerrAscend, mentioned above, seven other companies have less than 1x free cash flow adjusted current ratios, including Schwazze, AYR, Jushi, Cannabist, TerrAscend, Ascend, and 4Front. These companies are high-risk with both high market leverage and low liquidity. Some of these companies score lowly on our liquidity measure because we have elected to count excess tax debt as a current liability.
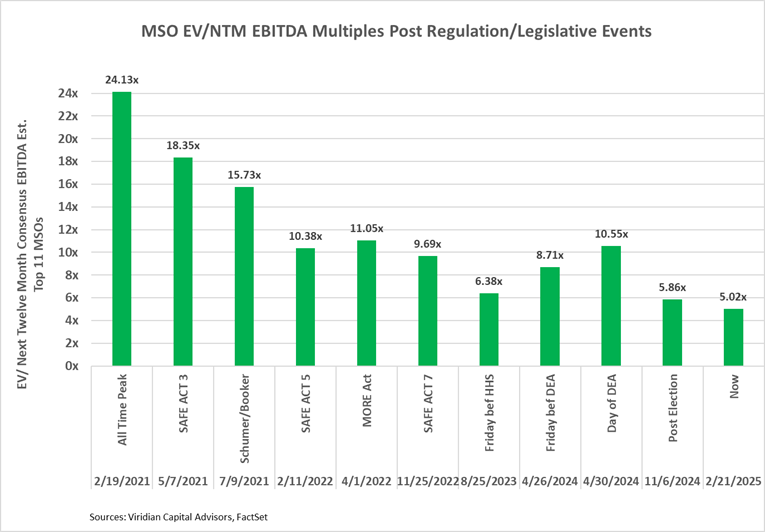
- EV/LTM MULTIPLES ARE NOW SIGNIFICANTLY LOWER THAN BEFORE THE ORIGINAL HHS RESCHEDULING ANNOUNCEMENT ON 8/30/23
- We continue to believe that at current levels, U.S. MSOs have enormous upside potential. The graph below shows the multiples reached after a number of past legislative/regulatory events. It makes clear that a doubling of prices is a reasonable possibility.
- We recommend a “don’t step in the doggy do do” strategy. With refinancing risks made worse by cratering stock prices, this is no time to be a hero. Focus on building a diversified portfolio of companies ranked in the top 10 in our credit rankings. Put them in your portfolio and follow the total liabilities to market cap indicator that we recommended several weeks ago, as well as the credit tracker rankings. And resist the urge to look at the stock prices every day!
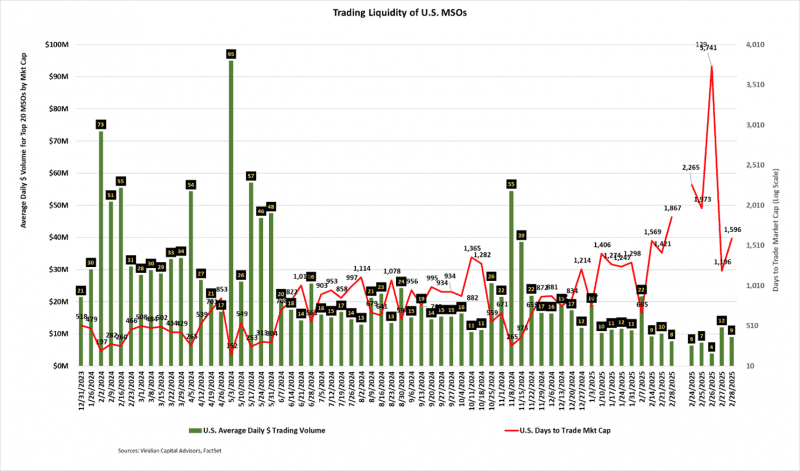
- MSO STOCK LIQUIDITY REMAINS AT ALL-TIME LOWS
- The average daily dollar volume of $8M for the week ending 2/28/25 was the lowest for the last 12 months.
- The Days to Trade Market Cap (DTTMC) series depicts the number of days it would take to trade the market cap of a stock or group of stocks. The current DTTMC of 1867 implies that an investor who acquired a 5% position in the stock, assuming he wanted to be less than 25% of the average daily dollar volume, would require 373 days to trade out of his position.
- GIVING CREDIT WHERE CREDIT IS DUE
- The chart below shows our updated 2/28/25 credit rankings for 31 U.S. cannabis companies. The number below the ticker symbol indicates the change in credit ranking since last week, where a negative number suggests credit deterioration, while a positive indicates improvement.
- We have made a significant change in our evaluation of liquidity. We used to add the long-term liability account “uncertain tax liabilities” to current liabilities in the calculation of the current ratio and, in our bespoke ratio, the free cash flow adjusted current ratio. Our rationale was that the IRS did not recognize the long-term nature of this liability and could theoretically press for immediate payment. Our thinking has changed. While we still maintain that these unpaid 280e taxes should be considered debt and included in leverage calculations, we do not think there is a credible case for the IRS to demand immediate payment. At worst, these amounts will be subject to some sort of payment plan. The biggest beneficiary of this model change is TerrAscend, which has improved by four ranking notches.
- The blue squares show the offered-side trading yields for each Company. Cannabist yields have come down significantly to the mid-20% range since the announcement of the company’s restructuring plan.
- Cannabis equity prices (as measured by the MSOS ETF) declined 7.5% for the week, finishing at all-time lows.
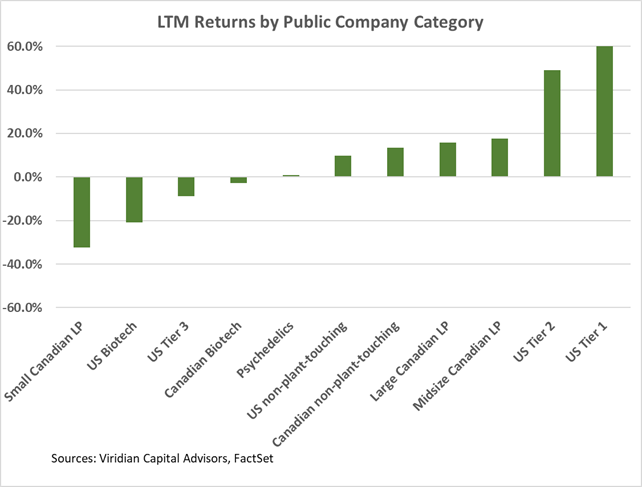
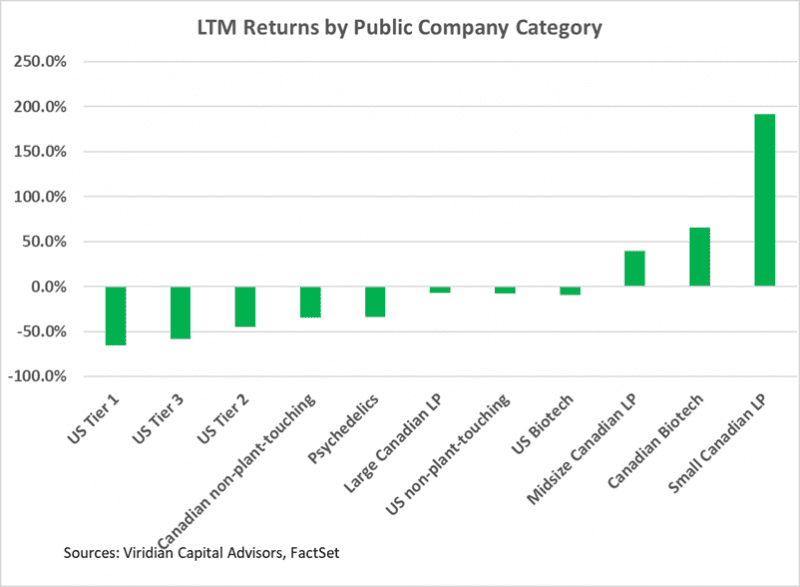
Trailing 52-Week Returns by Public Company Category:
-
- U.S. Tier one through three MSOs now are the worst three YTM return categories, which is not that surprising given that many of these stocks are now trading at or near all-time lows.
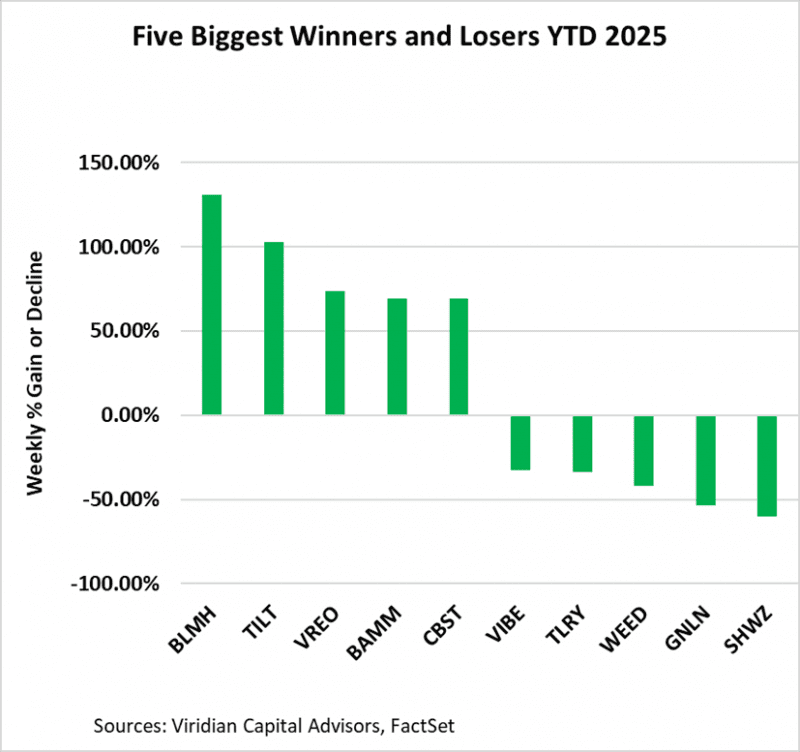
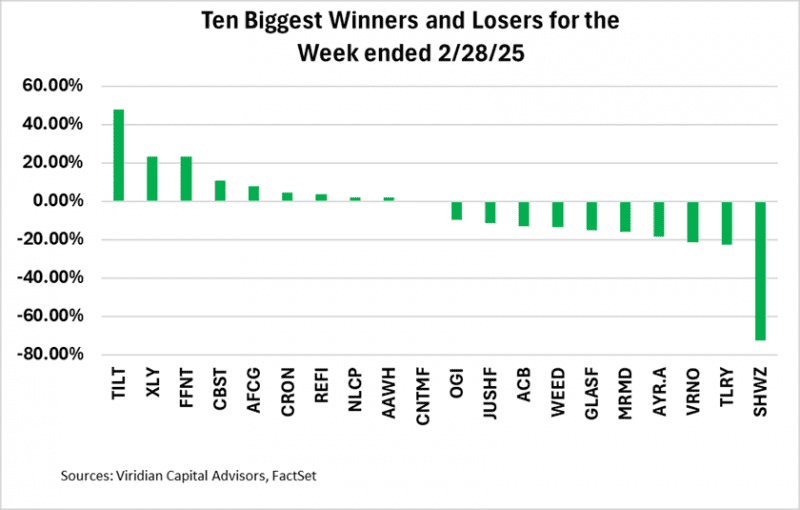
Best and Worst Performers for the week:
- The four largest gainers of the week are all trading like out-of-the-money options and are reacting to increased volatility.
- Most of the biggest losers are in similar shape except for Verano (VRNO: Cboe), which traded lower after missing earnings estimates.. We saw no proximate cause for the downturn in Tilray (TLRY: Nasdaq) or MariMed (MRMD: CSE)