OUR 9TH YEAR OF PROVIDING PROPRIETARY CAPITAL MARKETS INTELLIGENCE ON THE CANNABIS / HEMP / PSYCHEDELIC SECTORS
Each week, Viridian publishes insights and analysis on completed capital raise transactions in the prior week, focusing on all equity and debt deals. Our analysis includes:
- Summary
- Outlook
- Best & Worst Perfromers
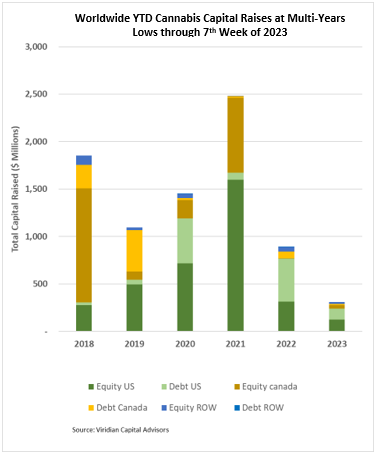
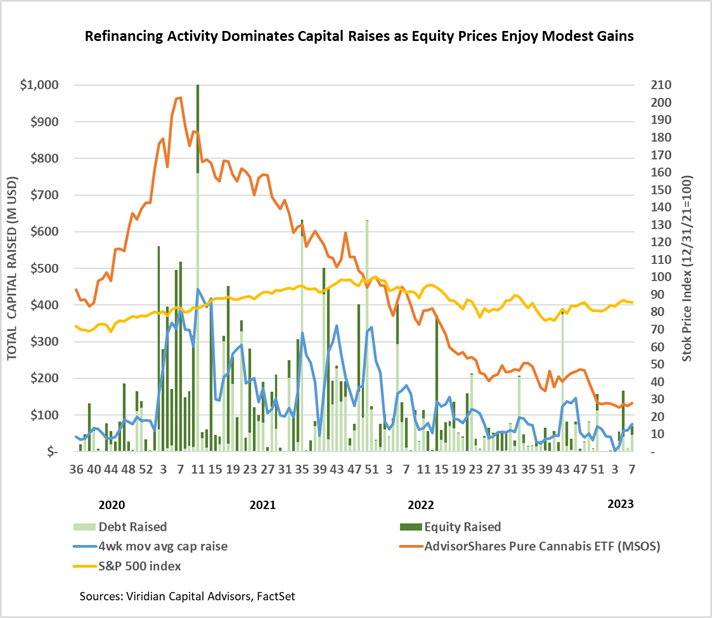
Cannabis capital raises are off to a multi-year low. Only $312.1M has closed through the first seven weeks of the year compared to $891.1M last year.
- Public companies have raised only 59.8% of total capital YTD, down from 79.6% last year.
VIRIDIAN INSIGHTS
- Canopy Growth (CGC: Nasdaq), one of the subjects of our Illiquidity vs. Insolvency graph last week, announced a placement of a $150M 5% senior unsecured convertible debenture due 2/28/28. The conversion price will be 92.5% of the VWAP of the stock before conversion. We calculate an effective cost of this debt at approximately 17.5% due to the embedded 100% coverage of 5-year warrants at discount exercise prices. Unsurprisingly, the company has stated that it will not list the notes for trading on any public exchange.
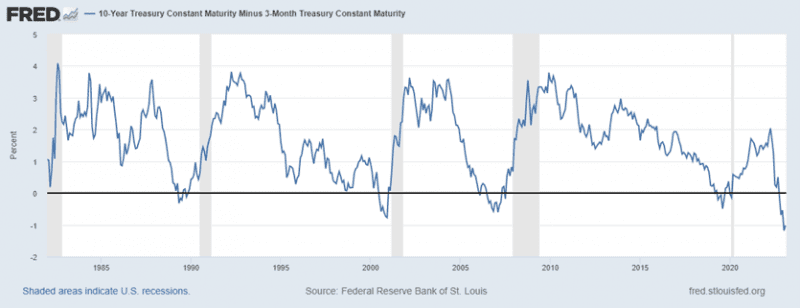
- The 3-month vs. 10-year treasury spread is still close to the most inverted since 1981, at negative 102bp. We like to watch this spread as opposed to the more commonly monitored 2yr-10yr spread for two reasons: 1) it is the measure that the Fed focuses more attention on, and 2) this measure does a better job of mirroring bank lending economics. This inversion has successfully predicted the previous five recessions, and we don’t think it will miss this time either. Investors have slowly realized that the Fed is not about to pivot anytime soon since it considers inflation quite ingrained and sticky. The chart below makes it clear that in virtually every case, the yield curve will begin to steepen before the onset of the recession
- Arguably, cannabis is already in a recession, at least in many developed markets where profitability has been sapped by commodification-driven wholesale price declines exacerbated by inflation-driven cost increases. We continue to hear pundits bemoan the “race to the bottom” of pricing as though competitors in an agricultural commodity-based business have many choices. Unfortunately, we believe this is not a temporary condition but a sign of things to come. Retailers continue to tell us that their customers are primarily concerned with price and THC content, which spells commodity. It’s another reason why we consider federal legalization and the eventual interstate commerce it will bring to be the industry’s most significant long-term risk factor.
- The good news is there is still only $30B of legal cannabis sales out of a total market size of $80B annually. This conversion of illegal to legal sales is the primary growth engine that should maintain cannabis’ status as one of the world’s fastest-growing industries for at least the next 5-10 years. There are still outsized profits, especially in newly legalized markets. Similarly, there is tremendous room for consolidation as even the largest of today’s MSOs is still relatively small in the context of U.S. CPG businesses.
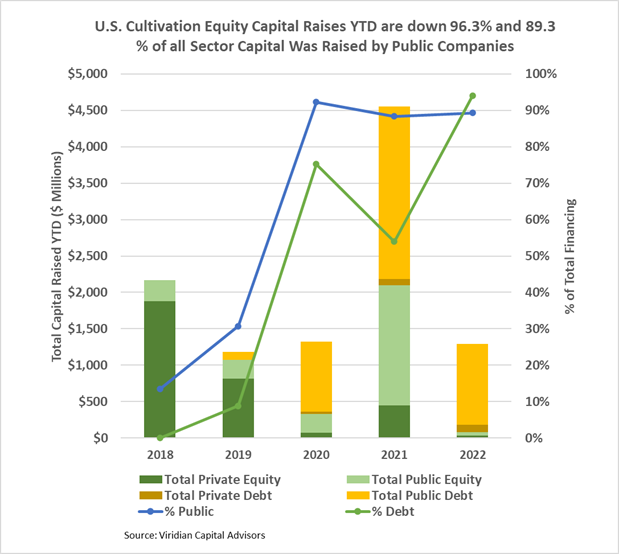
The U.S. Cultivation & Retail sector capital raises are down 71.6% YTD, but equity capital raised is down approximately 96.3%:
- Debt financing is down 50.6% YTD but accounts for about 94.0% of all capital raised; private companies raised 8.7% of it.
- 89.3% of total capital raises YTD were completed by public companies compared to 88.4% in 2021.
- In 2022, there have been no equity deals above $25M.
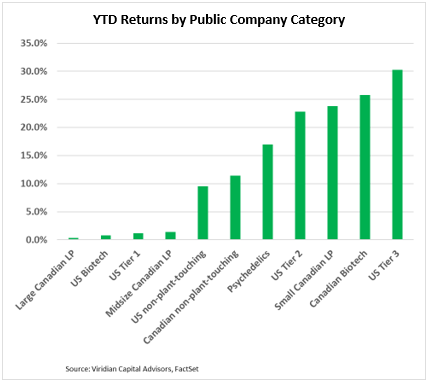
YTD Returns by Public Company Category
- Large Canadian LPs are still the worst-performing category in YTD returns, despite the 10% recovery in Canopy Growth.
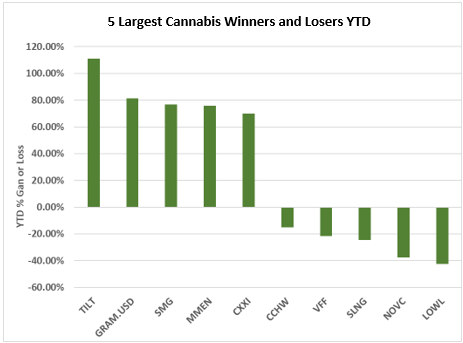
Best and Worst Performers of the last week and YTD