OUR 9TH YEAR OF PROVIDING PROPRIETARY CAPITAL MARKETS INTELLIGENCE ON THE CANNABIS / HEMP / PSYCHEDELIC SECTORS
Each week, Viridian publishes insights and analysis on completed capital raise transactions in the prior week, focusing on all equity and debt deals. Our analysis includes:
- Summary
- Outlook
- Best & Worst Perfromers
-
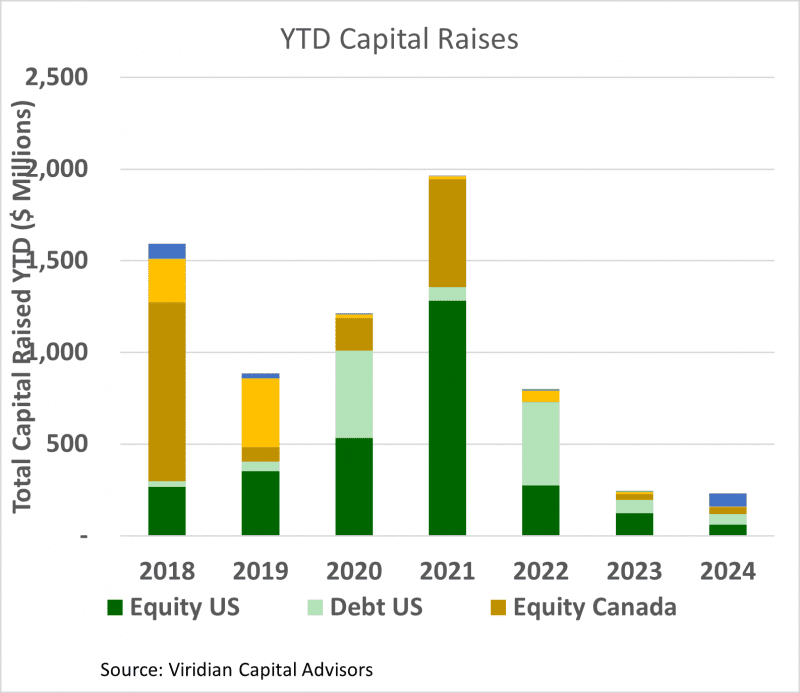
- YTD capital raises are down 29.5% since the same period in 2023. U.S. raises are down significantly more at -60.8%, with declines in equity and 3debt of 51.5% and 77.1%, respectively. Debt accounts for only 9.9% of total capital raised, the lowest percentage of any year since 2018 except for the bubble year of 2021. Countries other than Canada and the U.S. account for 31.1% of all capital raised (mainly U.K.), the highest percentage of any year on record at this point in the year.
VIRIDIAN INSIGHTS
- SEVEN CANNABIS PREDICTIONS FOR 2024 (updated since first publication)
- THE DEA WILL GO ALONG WITH RESCHEDULING TO LEVEL 3. However, the process may take longer than widely expected with public hearings and likely court appeals. Still, it will carry the day and be in place by year-end 2024. Yes, we do feel a bit gun-shy about predicting any positive cannabis regulatory or legislative change. Still, this one ostensibly can happen without any congressional vote, giving us more confidence.
- The SAFER ACT, HOWEVER, WILL CONTINUE TO STRUGGLE. WE HAVE DOUBTS THAT IT WILL BE ENACTED IN 2024. Internecine warfare in an election year will prevent any meaningful compromises from being reached. Senator Schumer will likely declare, “We are very close” for the umpteenth time only to fail to push it through. Frankly, the industry seems to have switched its focus to rescheduling, and the push for SAFER seems diluted.
- NEW STATES DRIVE A RESURGENCE IN GROWTH AND INCREASED EBITDA.
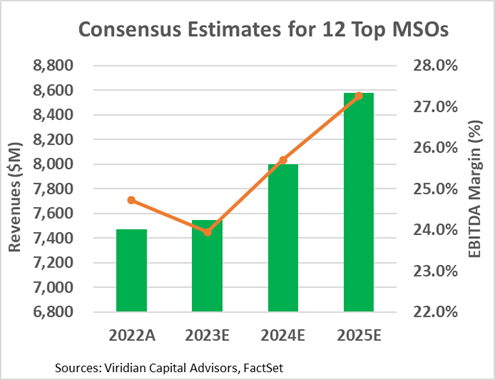
- The chart below shows consensus revenue and EBITDA margin estimates for the top twelve MSOs.
- Analysts may be too cautious with the group’s 2024 revenue growth projection of 6.0%. A year of Maryland and Ohio and near-term price stability in several key markets suggests a higher growth expectation may be in order.
- Similarly, we believe the 25.7% 2024 consensus EBITDA margins may be too low as they are only 100bp higher than the 2022 figures. The industry found religion in 2022 and 2023, stringently managing costs and tightening working capital controls. The industry is poised to be more efficient and profitable as growth returns.
- A Careful Look at EBITDA and Market leverage and a liquidity review suggest likely courses of action for some overleveraged MSOs.
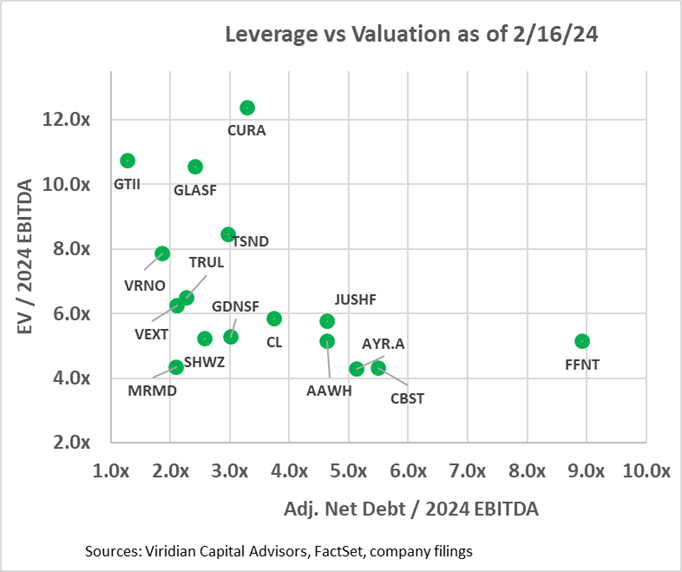
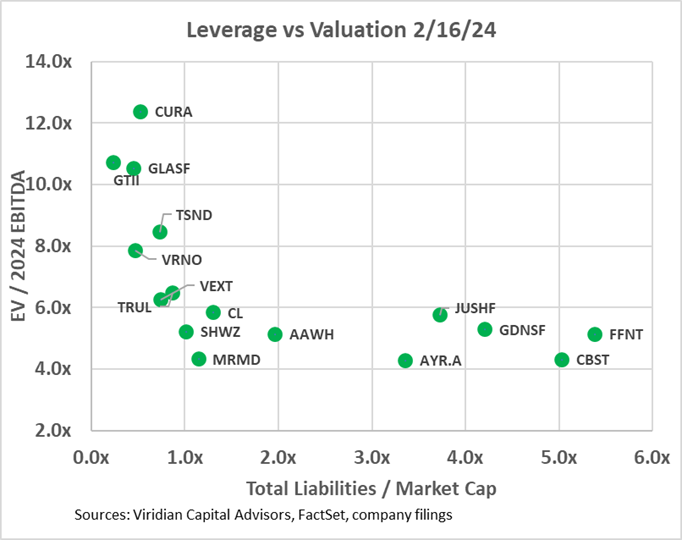
- The two graphs below show the Enterprise value to 2024 EBITDA multiples against two leverage measures. In the first graph, we have calculated an Adjusted Net Debt/ 2024 EBITDA figure by adding any accrued taxes over 90 days of tax expense to debt before subtracting cash to arrive at Adjusted Net Debt. We would expect any regular company to have accrued taxes equal to their last quarterly tax expense and consider that a standard working capital item. Several companies on the chart have far greater than 90 days of accrued taxes, and we consider the excess to be debt. Verano’s excess tax liabilities equal nearly 40% of its debt. Other companies with relatively high imputed tax debt include Curaleaf (CURA: CSE) and 4Front (FFNT: CSE) at 19%, and Terrascend (TSND: TSX) at 17%.
- A comparison of the two top graphs is instructive. Some companies like TerrAscend, Goodness Growth, and Curaleaf appear to be directly on or slightly over 3x adjusted net debt to EBITDA, which we view as the demarcation line of long-term sustainability.
- TerrAscend and Curaleaf have relatively low total liabilities to market cap because the market is valuing their stocks at such high multiples. These companies should issue equity at these high multiples to directly fund debt reduction or use equity to purchase another company and increase EBITDA. An acquisition of one of the companies trading at much lower EBITDA multiples is likely to be accretive.
- Goodness Growth is in precisely the opposite situation. It is not as levered as Curaleaf on an adjusted Debt to EBITDA basis. Still, its stock is trading at such low multiples that the prospect of issuing equity to reduce debt seems unlikely. Goodness Growth will likely have to sell assets or sell itself to work out of its overleveraged situation.
- Jushi, AYR, Cannabist, and 4Front appear significantly overleveraged in both an EBITDA and Market Cap sense. However, each has some element of optionality that might prove 2024 EBITDA estimates too conservative. For Jushi, it is Pennsylvania and Virginia. For AYR, it is Florida. Cannabis is in Ohio, New York, Pennsylvania, and Florida. 4Front is levered to Illinois.
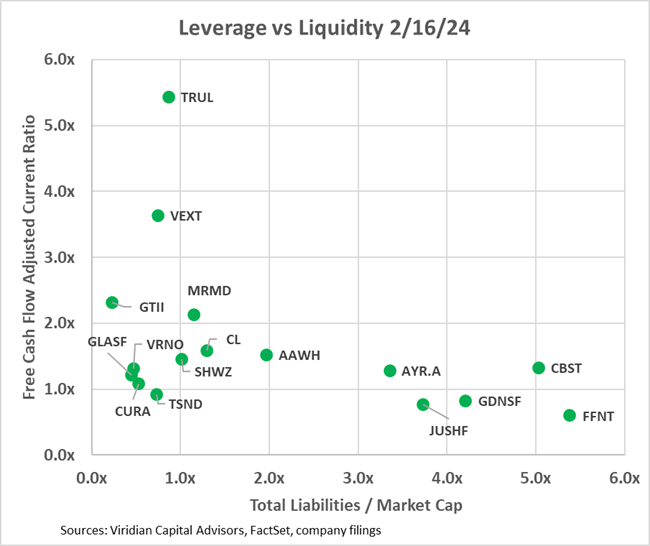
- The third graph shows that AYR and Cannabist have better liquidity than Jushi or 4Front and are less likely to need to push a highly dilutive equity deal or expensive debt deal into the market.
- Looking at leverage in two ways and having a comprehensive measure of liquidity can give investors a good idea of possible scenarios for today’s overleveraged companies.
-
-
- CANNABIS DEBT SECURITIZATION WILL TAKE OFF IN 2024. We believe the Pelorus securitization transaction completed in July was one of the most critical developments in cannabis debt of the past five years. Securitization is a logical extension of the cannabis debt markets, and the creation of over-secured tranches of debt based on diversified pools of loans will bring major institutional investors who have, to date, avoided the cannabis space into the market. Many impediments must be dealt with, including the unrated nature of the collateral and the difficulty of obtaining AAA ratings on the top tranche without some insurance wrap or massive over-collateralization. Still, the future seems clear: the enormous credit spreads available in cannabis will eventually be arbitraged by developing a complete debt capital market.
- Investors will seize on the value of senior secured cannabis debt with short maturities trading at significant premiums to our perception of relative credit quality. We were talking with investors at a recent conference, and one told us that he viewed GTI stock as a cash equivalent. We beg to differ. However, we view GTI and Trulieve as likely BB credits trading at 300bp or more over the BB high yield index yield with shorter maturity. It seems like a great risk-adjusted investment to us. Viridian publishes credit rankings of these companies every week with indicative debt pricing.
- CANNABIS M&A WILL BOUNCE BACK FROM ITS LOWEST YEAR EVER IN 2023. Despite its promising potential for rescheduling and legislative reform, 2024 will not immediately differ from 2023: capital markets remain challenged, and profitability is squeezed. Still, our Valuation Gap analysis (presented in the M&A section, indicates that large MSOs now possess the highest EV/NTM EBITDA multiple advantage that they have had since November 2021, augmenting the possibility of accretive transactions. So, even though the year is off to an even slower start than 2023, we are sticking to this prediction. We are beginning to think that we may even see MSO/MSO deals at current valuation spreads.
-
- CANNABIS STOCK LIQUIDITY IS SLOWLY IMPROVING
-
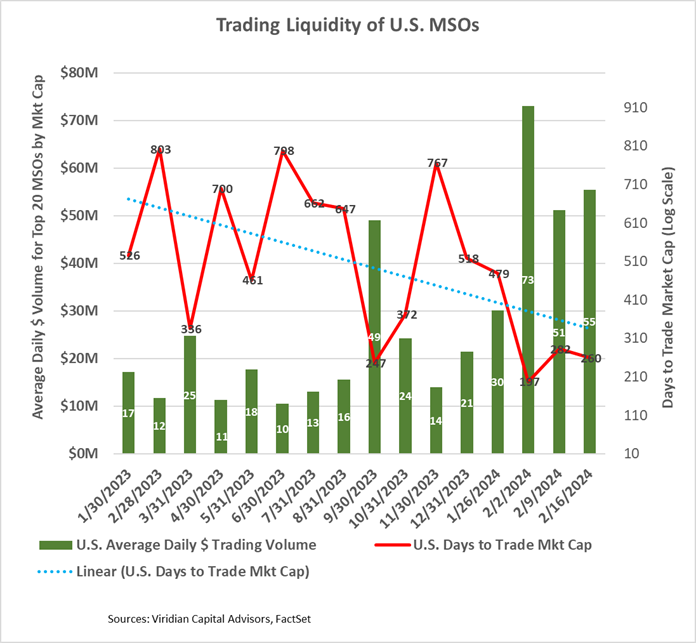
- The graph below depicts the trading liquidity of the fifteen U.S. MSOs with market caps over $100M as of 2/16/24. The green bars (measured on the left axis) show the group’s aggregate average daily dollar trading volume. The average daily dollar volume dropped from last week but remains higher than in any period in the previous year. The red line (measured on the right axis) shows the aggregate Days to Trade the Market Cap. (DTMC). The 260 days is down sharply from the 747 days registered in November but still represents significant illiquidity. As an illustration, if an investor took a 5% position in a stock with a 260 DTMC and wanted not to be over 25% of the average daily trading in the stock (so as not to disturb the market), it would take him 52 days to trade out of his position. The equivalent calculation for the top 5 Canadian LPs (trading on Nasdaq) is approximately seven days, illustrating the importance of up-listing. The dotted blue line shows DTMC’s improving trend.
- Despite the improving trend in liquidity, this week’s Viridian Chart of the Week shows how rebalancing a relatively small ETF portfolio can raise havoc on the still quite illiquid MSO stocks.

- GIVING CREDIT WHERE CREDIT IS DUE
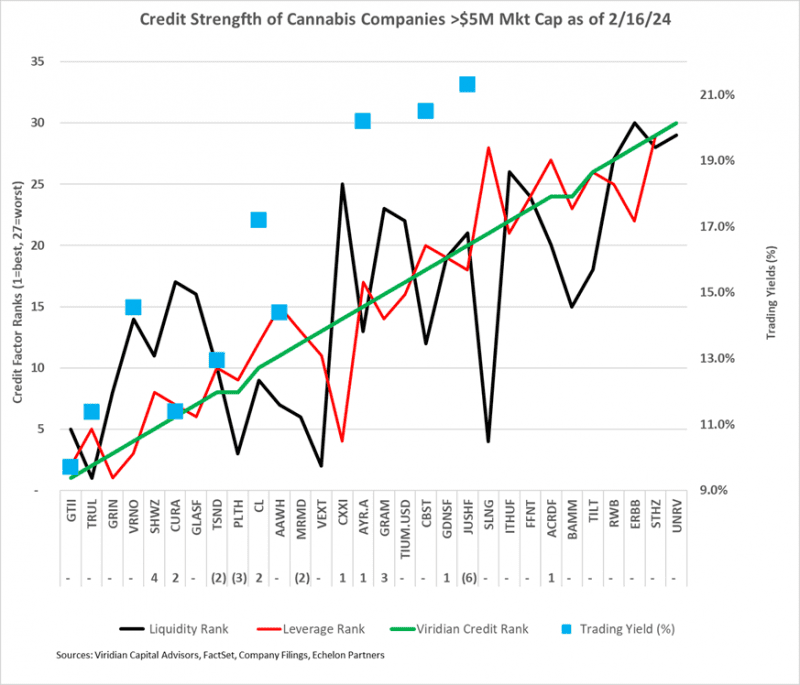
- The chart below shows our updated 2/16/24 credit rankings for the 30 US cannabis companies with over $5M market cap. The number below the ticker symbol indicates the change in credit ranking since last week, where a negative number suggests credit deterioration, while a positive indicates improvement.
- The blue squares show the offered-side trading yields for each company. Trading yields have declined significantly since the HHS rescheduling announcement.
- The week’s two most significant credit moves were the four-notch improvement by Schwazze (SHWZ: OTCQX), primarily because of improved relative market leverage. Jushi dropped six ranking notches due to our re-estimation of the company’s liquidity profile and a two-notch deterioration in its leverage ranking, primarily driven by relative market leverage.
- AYR, Cannabist, and Jushi are now trading at yields consistent with our relative credit rankings.
-
- NOTHING MATTERS BUT RESCHEDULING
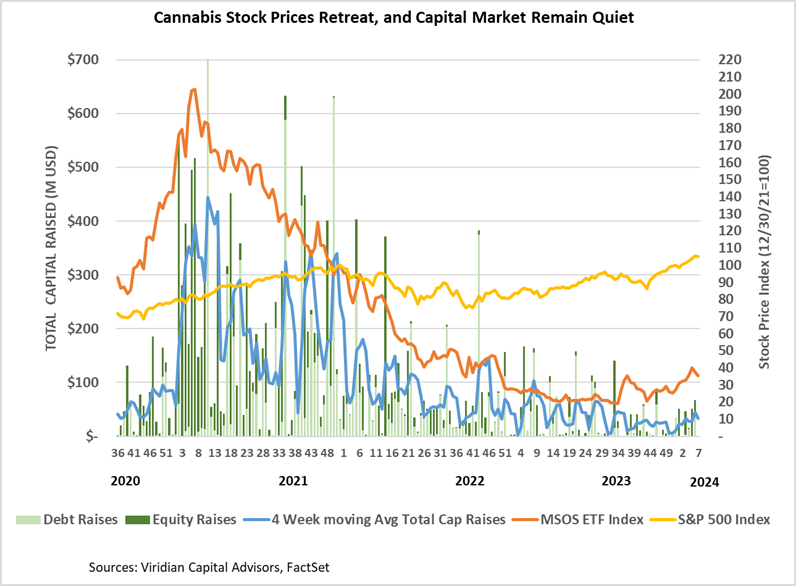
- The HHS recommendation to reschedule cannabis to Schedule 3 dramatically impacted equity prices, propelling the MSOS ETF upwards sharply. As of 2/9/24, the ETF was up 96.5% since the rescheduling news.
- The chart below shows enterprise to next-twelve-month valuation multiples now compared to previous times when positive regulatory/legislative news hit.
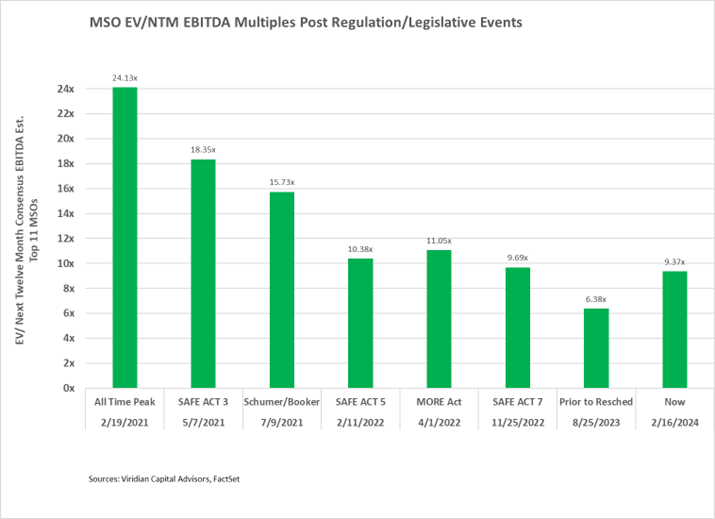
- EV/NTM EBITDA Multiples are now 10% below the levels after the 5th SAFE Act passage in the House in February 2022. Still, the rescheduling news is more significant as it dramatically impacts cash flows. If valuations multiples rose to where they were after the announcement of the Schumer-Booker bill, the incremental gains would equal 67,9%. We view a DEA announcement ratifying the HHS recommendation to be much more significant than introducing the Schumer-Booker bill, which most observers viewed as DOA and had no immediate impact on operator cash flows. Accordingly, we believe there is considerably more runway for price increases, perhaps reaching the 5/7/21 multiples of 18.35x, producing 95.8% returns from current levels.
FINANCIAL IMPACTS OF REMOVING 280e
- The table below demonstrates that for a hypothetical cannabis company with 50% gross margins, 20% SG&A, and 3x Debt/ EBITDA, 280e can result in effective tax rates (on pretax income) of over 100%.
- The table demonstrates our previous claim that debt/EBITDA over three times is unsustainable in a 280e world, as the calculated payback period for the debt would be an unacceptable 12.26 years. Cannabis companies under 280e need less than 2x debt/EBITDA to have acceptable 5-year payback periods. The table shows that combined effective rates (depending on state tax rates) would be reduced to around 27% without 280e, making a considerable difference in debt capacity.
- Without 280e, companies could carry 3x leverage with acceptable payback periods. By making interest expense tax deductible, the elimination of 280e also reduces the cannabis cost of capital and increases the intrinsic value of the firms.
- Removing 280e would still not support the level of debt we now see in the industry. Six of the top sixteen companies have adjusted net debt/2024 EBITDA over 4x, which is unsafe even without 280e, especially given ongoing cost inflation and wholesale price compression.
-
-
- We estimate annualized tax savings of the top 13 MSOs at $700M.
-

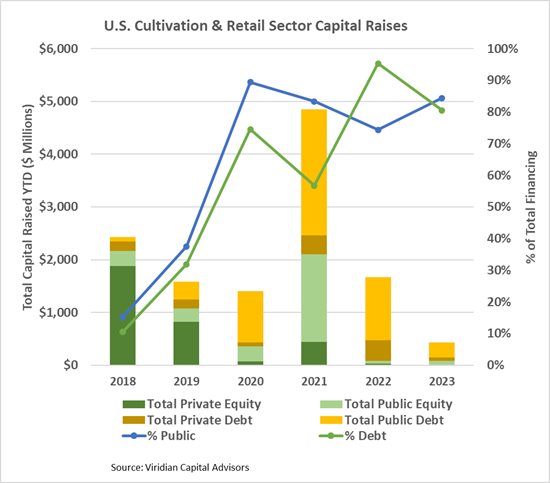
- We expect capital markets to remain tight until more clarity arises regarding rescheduling. The graph below shows annual cultivation & retail trends over the last few years.
- Cannabis equities (as measured by the MSOS ETF) were down 6.44% for the week as the rebalancing of the MJUS ETF gave additional downside push.
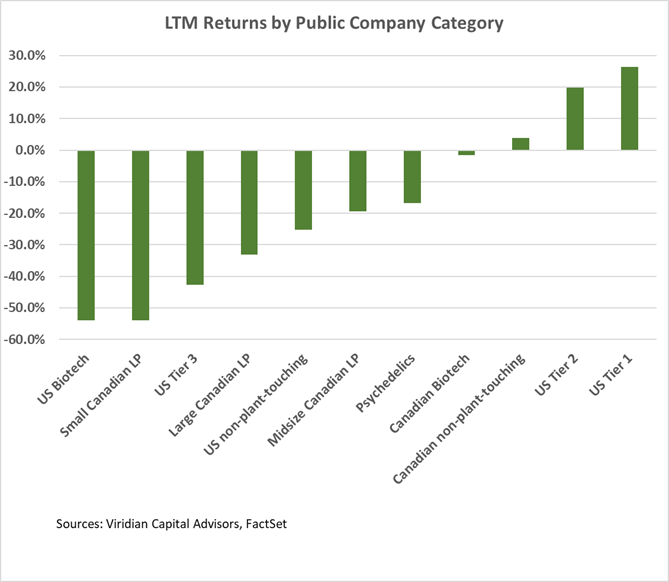
Trailing 52-Week Returns by Public Company Category:
- Unsurprisingly, US Tier One MSOs continue performing best out of our eleven categories, with Tier Two MSOs close behind.
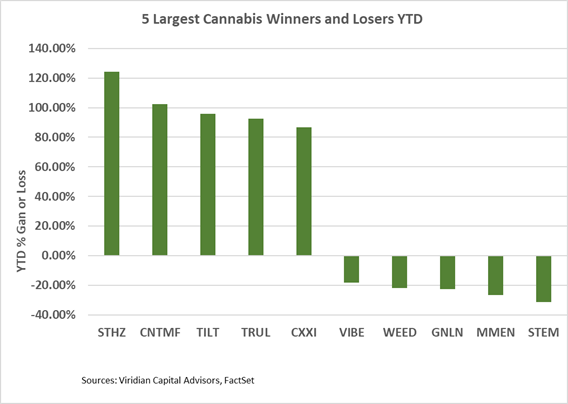
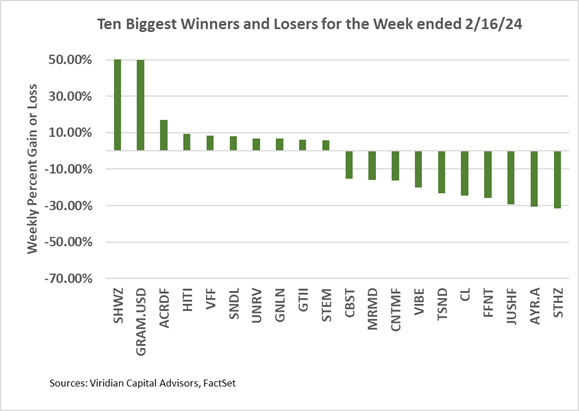
Best and Worst Performers of the last week and YTD:
- Schwazze (SHWZ: OTCQX) was the week’s biggest gainer, up 51.99% on large insider stock purchases.
- Losers include names levered to a rescheduling announcement, including AYR, Cannabist, Cresco, Jushi, and 4Front.