OUR 9TH YEAR OF PROVIDING PROPRIETARY CAPITAL MARKETS INTELLIGENCE ON THE CANNABIS / HEMP / PSYCHEDELIC SECTORS
Each week, Viridian publishes insights and analysis on completed capital raise transactions in the prior week, focusing on all equity and debt deals. Our analysis includes:
- Summary
- Outlook
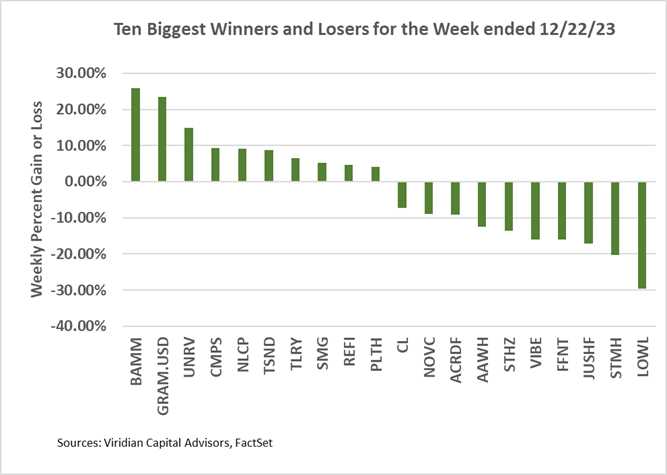
- Best & Worst Perfromers
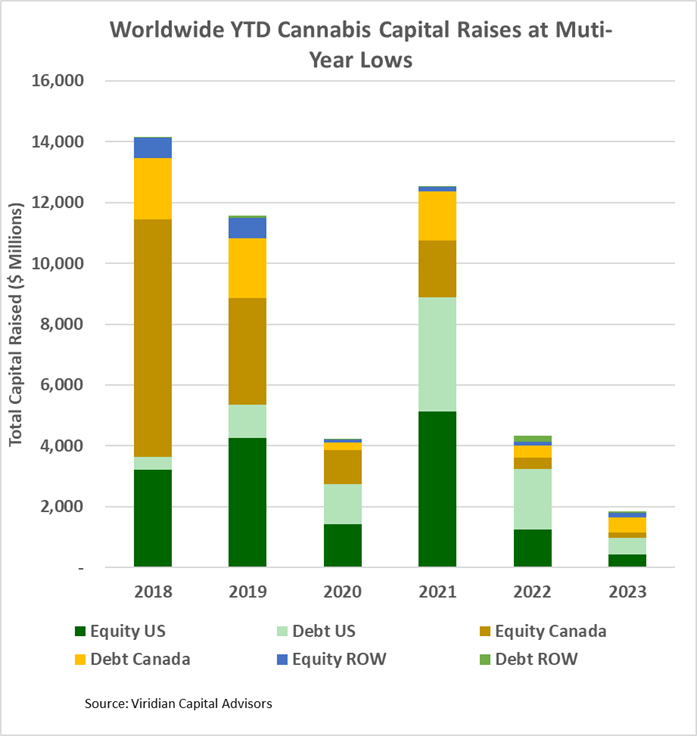
- Cannabis capital raises are ending the year on a multi-year low. Only $1.85B closed through the fifty-one weeks ended December 22, 2023, compared to $4.33B last year.
- Debt represents 61.0% of total capital raised, significantly higher than in any other comparable period since before 2018.
- Public companies have raised 74.3% of total capital YTD, lower than any comparable period since 2019.
- International raises accounted for 10.6% of the total, the most significant percentage since before 2018.
VIRIDIAN INSIGHTS
-
- TEN KEY CANNABIS HAPPENINGS OF 2023
- Greetings from Key West! Sitting about a mile from the Southernmost point in the U.S., we have been pondering the aspects of the cannabis business that went South during 2023 and which may be warming up for a better 2024. Next week, we will present our 2024 outlook and predictions
- COMMODITIZATION-DRIVEN PRICE COMPRESSION MEETS INFLATION-DRIVEN COST INCREASES. Cannabis got the worst of all worlds: constrained revenues and lower margins. At the beginning of 2023, analysts expected the top ten MSOs to have 25.4% revenue growth for the year, but these estimates have been revised to down 0.6%. Similarly, analysts started the year projecting EBITDA margins of 27.2% for the group, but these estimates have fallen to 24.6%. Wholesale price compression entered the collective vocabulary with a vengeance, and pricing declined in nearly every market open for more than a year. Commoditization may be the most potent headwind for the industry.
- ANOTHER SAFE ACT HEAD FAKE The cannabis world went into 2023 with great optimism based on a regime change in Washington, D.C., promising significant progress in regulatory and legislative reform. Shame on us for believing you again, Chuck Schumer!
- Greetings from Key West! Sitting about a mile from the Southernmost point in the U.S., we have been pondering the aspects of the cannabis business that went South during 2023 and which may be warming up for a better 2024. Next week, we will present our 2024 outlook and predictions
- RESCHEDULING REPLACES THE SAFE ACT AS THE PRINCIPAL FOCUS OF THE MARKET. Cannabis participants hardly discuss the SAFER Act anymore, as all attention is on the DEA and its upcoming decision on rescheduling. The change of focus makes sense because, unlike SAFER, rescheduling will make a considerable difference in cannabis cash flows. The effects range from around $700M annual savings for just the top ten MSOs to reduced cost of capital, higher debt capacity, and higher internally supportable growth, a true game changer. Will it happen? At the risk of jinking it, we are optimistic.
- THE CAPITAL MARKETS TOOK AN EXTENDED VACATION. We all thought 2022 was a lousy year until we saw 2023! Worldwide cannabis capital raises dropped 57.3% from 2022, nearly 56% lower than the last capital freeze year in 2020. The cultivation and retail sector, which generally accounts for over half of all capital raises, was particularly hard hit: total capital raises of around $400M were off 75% from an already horrible year in 2022
- DEBT CONTINUED TO BE THE ONLY GAME IN TOWN FOR PLANT-TOUCHING CAPITAL RAISES, accounting for over 75% of U.S. Cultivation and Retail sector raises in 2023
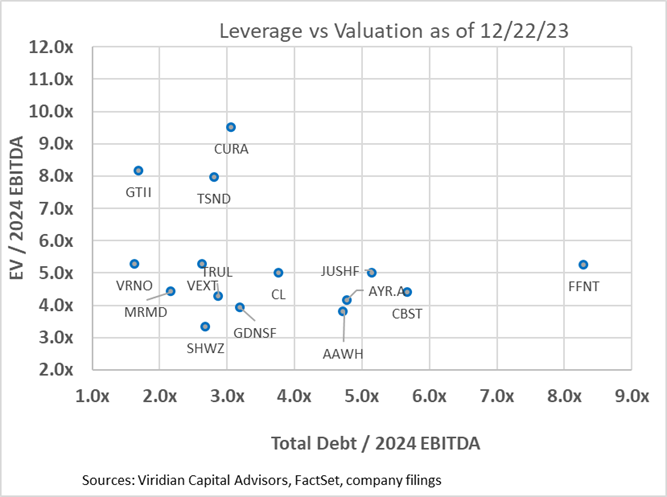
- THE RELIANCE ON DEBT FINANCING LED TO OVERLEVERAGE AND THE INABILITY TO REFINANCE DEBT MATURITIES. COMPANIES DID WHAT THEY HAD TO: AMEND AND EXTEND. No CFO in his right mind wanted to raise equity in 2022 or 2023, but reliance on debt financing has its costs. Eight of the fifteen top MSOs in the chart below have Debt/ 2024 EBITDA over 3x, an unsustainable leverage level in a 280e world. We had hoped that positive legislative developments would open an equity financing window to allow for leverage reduction, but that has not happened. Instead, companies with significant 2024 maturities kicked the can down the road, giving up warrants and fees to extend maturities until 2026. 2024 and 2025 now appear relatively benign, but the clock is still ticking.

- THE MOST NOTABLE M&A DEAL OF 2023 IS THE ONE THAT DIDN’T HAPPEN. The $2B acquisition of Columbia Care by Cresco suggested a new wave of public companies buying other public companies. The deal’s failure had much to do with the closed cannabis capital markets, making raising money to acquire the required divestitures nearly impossible. Cresco came out of the deal in a more robust financial condition, and Columbia Care (Now Cannabist) entered into a series of negotiations with debt holders for amendments and extensions.
- MSOS EXITED KEY MARKETS AS COMPANIES FOCUSED ON DEPTH AND PROFITABILITY RATHER THAN BREADTH AND POTENTIAL GROWTH. Curaleaf exited California, Washington, and Colorado. Trulieve abandoned Massachusetts. Cresco and AYR both bailed on Arizona. And 4Front left California.
- CANNABIS COMPANIES TIGHTENED THEIR BELTS AND BECAME MORE EFFICIENT IN 2023. Faced with virtually closed capital markets, cannabis companies, for the first time, acted like regular, for-profit corporations, reducing expenses primarily by trimming staff, tightening controls on working capital, reducing capital spending, and canceling non-strategic acquisitions. The result is a more robust, leaner, and focused industry better positioned to take advantage of future growth.
- A LITTLE-APPRECIATED REVOLUTION IN CANNABIS FINANCE OCCURRED WITH THE FIRST CANNABIS SECURITIZATION. In July 2023, Pelorus Capital completed the first securitization of cannabis loans, selling $45M of senior securities against a $70M secured loan portfolio. The one-tranche deal was simple by CLO standards, but most observers thought it could never happen until after legalization. The deal’s importance is that the investor base was primarily public funds that had previously avoided the cannabis space. Securitization offers the opportunity to create safer slices of debt that may be more amenable to new institutional investors. We expect to see more increasingly complex securitizations in 2024.
- TEN KEY CANNABIS HAPPENINGS OF 2023
- GIVING CREDIT WHERE CREDIT IS DUE
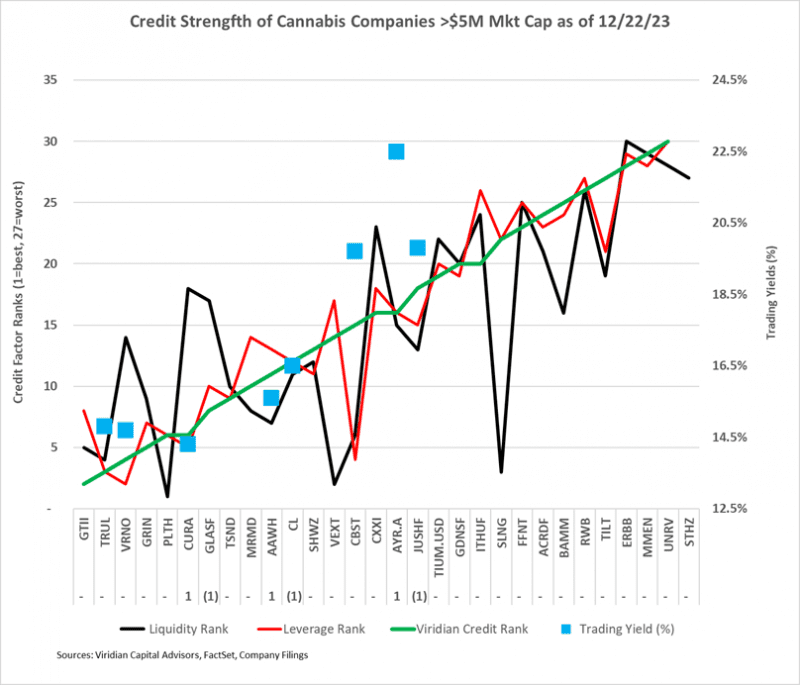
- The chart below shows our updated 12/22/23 credit rankings for the 30 U.S. cannabis companies with over $5M mark/t cap. The number below the ticker symbol indicates the change in credit ranking since last week, where a negative number suggests credit deterioration, while a positive indicates improvement.
- The blue squares show the offered-side trading yields for each company.
- Verano and Trulieve appear to be more rationally priced than Curaleaf, offering higher yields at what we believe to be lower risk. In the mid-tier credits, Cresco and Ascend debt are attractively priced.
- DOES THE MARKET CARE ABOUT ANYTHING OTHER THAN RESCHEDULING?
- The HHS recommendation to reschedule cannabis to Schedule 3 dramatically impacted cannabis equity prices, propelling the MSOS ETF upwards by nearly 85%. But as of 12/22/23, the ETF was only up 16.3% from before the rescheduling news.
- The chart below shows enterprise to next-twelve-month valuation multiples now compared to previous times when positive regulatory/legislative news hit.
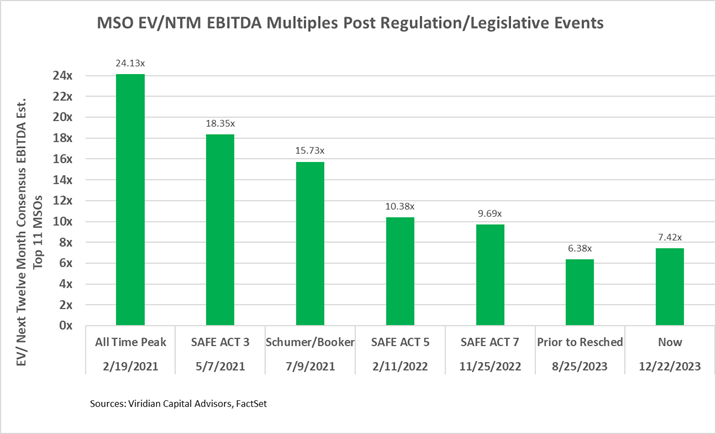
- EV/NTM EBITDA Multiples are now 28.5% below levels after the 5th SAFE Act passage in the House in February 2022. Still, the rescheduling news is more significant as it dramatically impacts cash flows. We conclude that there is significantly more potential for multiple expansions. If valuations multiples rose to where they were after the announcement of the Schumer-Booker bill, the incremental gains would equal 112.0%.
- The table below demonstrates that for a hypothetical cannabis company with 50% gross margins, 20% SG&A, and 3x Debt/ EBITDA, 280e can result in effective tax rates (on pretax income) of over 100%.
- The table demonstrates our previous claim that debt/EBITDA over three times is unsustainable in a 280e world, as the calculated payback period for the debt would be an unacceptable 12.26 years. Cannabis companies under 280e need less than 2x debt/EBITDA to have acceptable 5-year payback periods. The table shows that combined effective rates (depending on state tax rates) would be reduced to around 27% without 280e, making a considerable difference in debt capacity.
- Without 280e, companies could comfortably carry 3x leverage with acceptable payback periods. By making interest expense tax deductible, the elimination of 280e also reduces the cannabis cost of capital and increases the intrinsic value of the firms.
- Removing 280e would still not support the level of debt we now see in the industry. Six of the top sixteen companies now have debt/2024 EBITDA over 4x, which is unsafe even without 280e, especially given ongoing cost inflation and wholesale price compression.
- We estimate annualized tax savings of the top 13 MSOs at $700M.

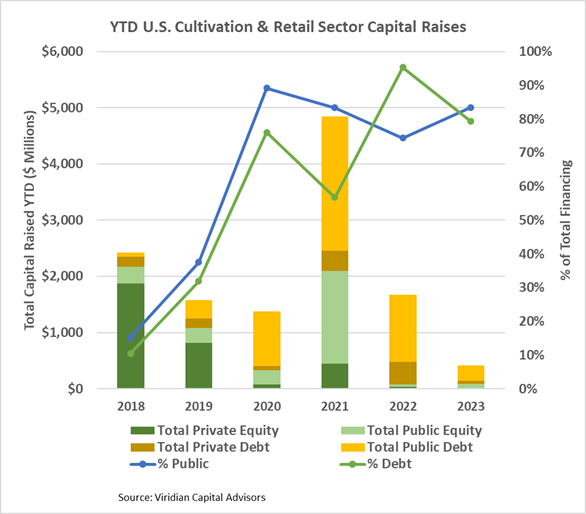
- YTD, U.S. Cultivation & Retail sector capital raises are down 75.5% from 2022 and are lower than any previous comparable period since before 2018
- Debt is still the dominant form of funding, accounting for 79.3% of all cultivation sector capital raised. 18.1% of the debt raised YTD has been for private companies.
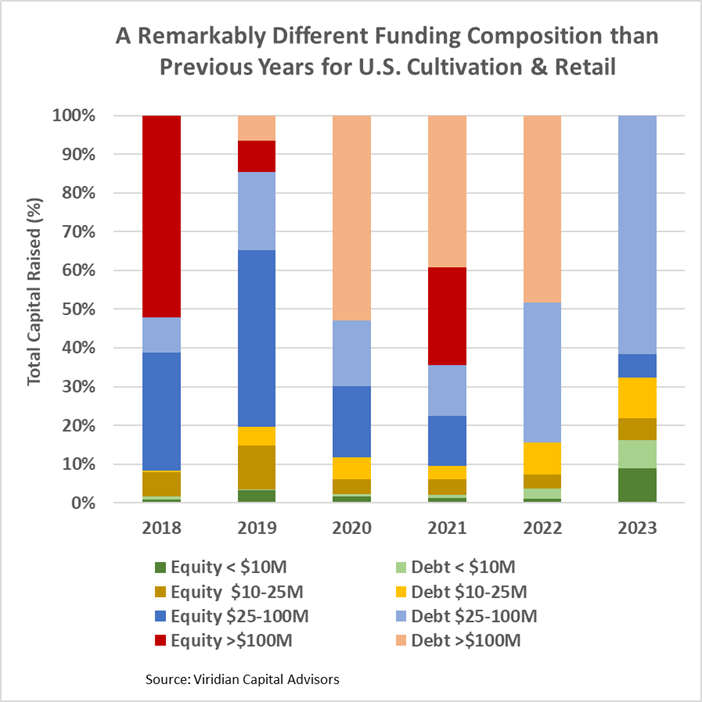
- Large transactions are still absent from the market. There have been no debt or equity deals over $100M YTD. The graph below shows the strikingly different composition of U.S. Cultivation & Retail capital raises in 2023 compared to previous years, with small equity and midsized debt dominating raises.
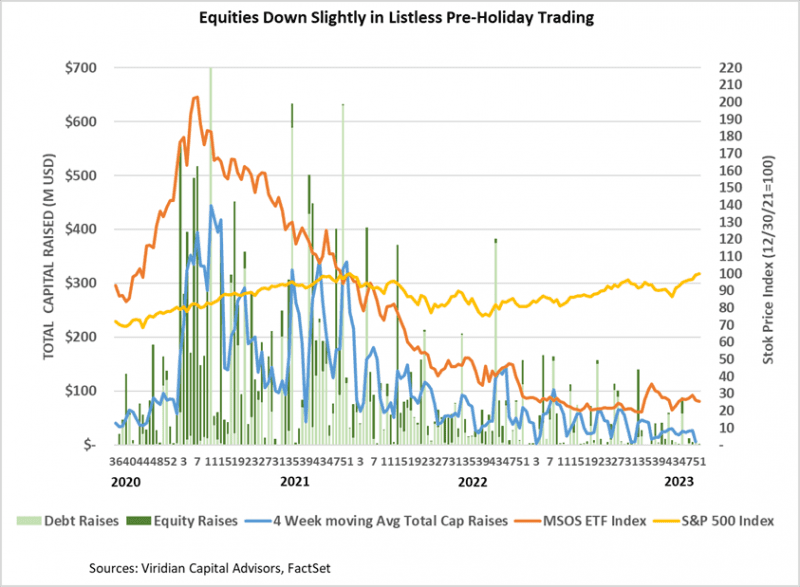
- Cannabis equities (as measured by the MSOS ETF) were down 2.11% for the week.
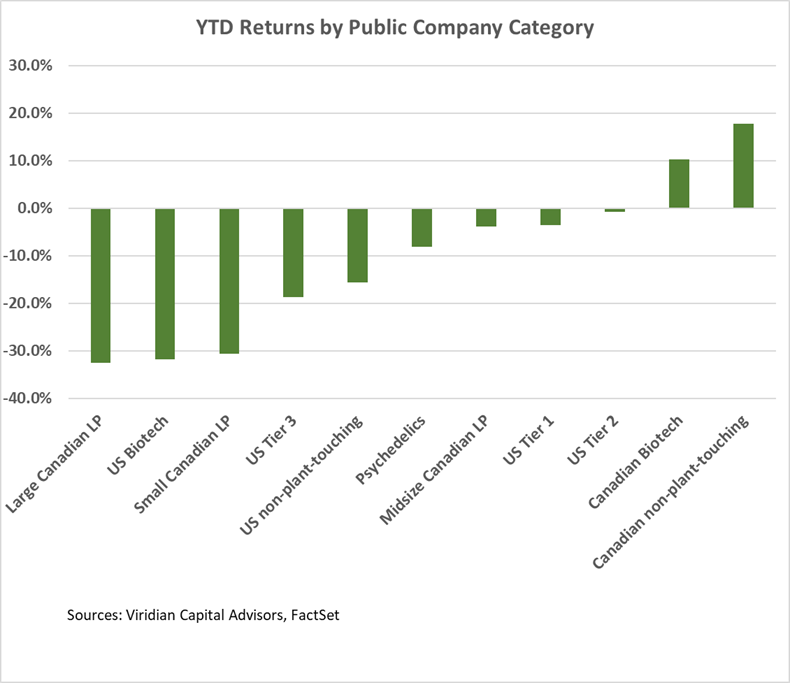
YTD Returns by Public Company Category:
- Only two categories show gains for the year.
Best and Worst Performers of the last week and YTD: