OUR 9TH YEAR OF PROVIDING PROPRIETARY CAPITAL MARKETS INTELLIGENCE ON THE CANNABIS / HEMP / PSYCHEDELIC SECTORS
Each week, Viridian publishes insights and analysis on completed capital raise transactions in the prior week, focusing on all equity and debt deals. Our analysis includes:
- Summary
- Outlook
- Best & Worst Perfromers
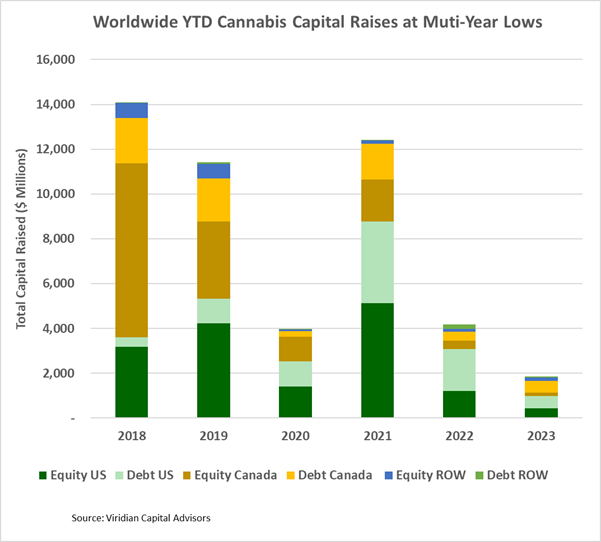
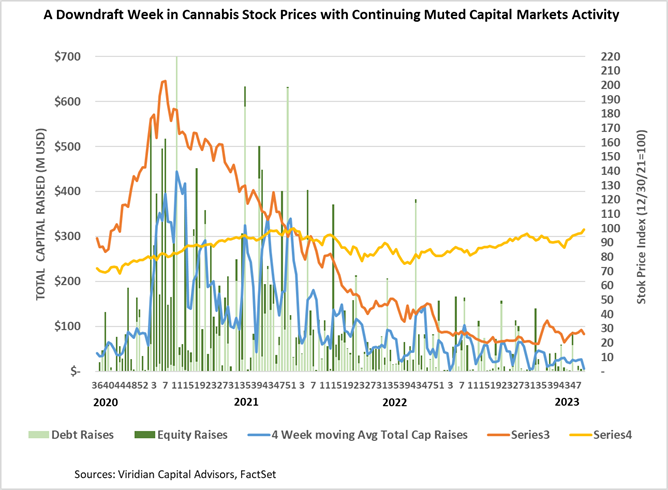
- Cannabis capital raises are running at a multi-year low. Only $1.85B closed through the first fifty weeks of the year compared to $4.17B last year.
- Debt represents 61.0% of total capital raised, significantly higher than in any other comparable period since before 2018.
- Public companies have raised 74.5% of total capital YTD, matching last year’s figure but otherwise lower than any comparable period since 2019.
- International raises accounted for 10.7% of the total, the most significant percentage since before 2018.
VIRIDIAN INSIGHTS
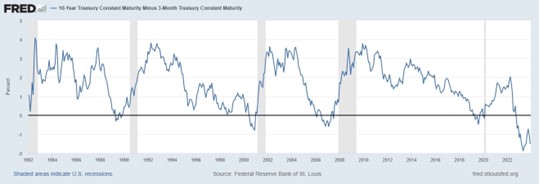
- ARE THE MARKETS TOO CONVINCED THAT THE FED WILL ENGINEER A SOFT LANDING?
-
- The markets are convinced that the FED will cut rates up to six times in 2024 and that a soft landing is virtually assured. The historically inverted 3-month / ten-year yield curve above suggests otherwise. We do not believe Powell has gone full dove; frankly, if he has, that would make us twice as scared. Does he see some weakness that the market is missing? One thing we know is that you don’t get paid much to hold the consensus view.
- Our Chart of the Week shows that cannabis investors are more cautious. The median premium over the 52-week lows for the group of MSOs we looked at was 59%, which strikes us as rationally pricing in an expectation that the DEA will PROBABLY play ball. Nonetheless, several companies, including Ascend, Glass House, and AYR, are trading at 2.5x their lows, making them vulnerable to bad news (or no news).
- TROUBLE IN LOAN TO OWN LAND
- It has never surprised us that Loan-to-Own has never become a thing in cannabis. It’s just not the right kind of business for that strategy. It’s too damm hard for even the most grizzled industry veterans to make any money in cannabis, let alone the banker who just repossessed their cultivation site.
- So, we were surprised when SNDL formed a lending group that seemed intent on following that strategy. After all, why else would you lend to Skymint and Parallel if that wasn’t your goal?
- But we may never know if they could have pulled it off since minority owner lawsuits are now halting the transfer of assets in both cases. SNDL may ultimately prevail, but it is not going according to plan.
- GIVING CREDIT WHERE CREDIT IS DUE
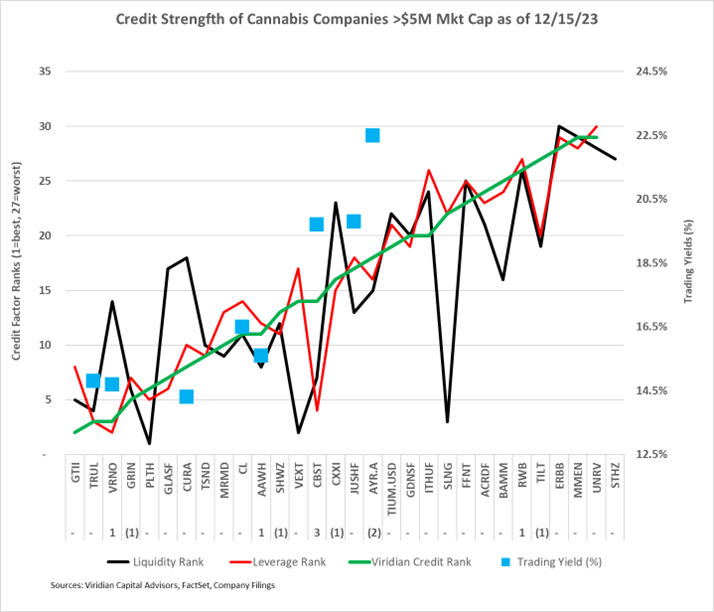
- The chart below shows our updated 12/15/23 credit rankings for the 30 U.S. cannabis companies with over $5M mark/t cap. The number below the ticker symbol indicates the change in credit ranking since last week, where a negative number suggests credit deterioration, while a positive indicates improvement.
- The blue squares show the offered-side trading yields for each company.
- Verano and Trulieve appear to be more rationally priced than Curaleaf, offering higher yields at what we believe to be lower risk. In the mid-tier credits, Cresco and Ascend debt are attractively priced.
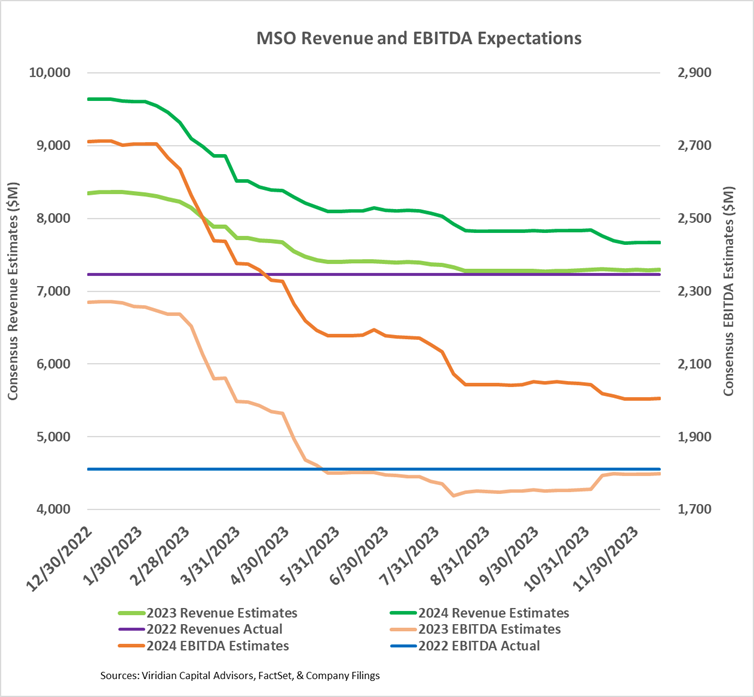
- NOT MUCH TO CHEER ABOUT IN 2023 AND 2024 CONSENSUS ESTIMATES
- The graph below shows consensus revenue and EBITDA estimates for the 10 top MSOs for 2023 and 2024. 2023 consensus EBITDA margins of 24.7% are now 9%, below the beginning of the year expectations of 27.2% and 2022 actual margins of 25.0%.
- The green lines at the top show that 2023 revenues are expected to be 1% higher than 2022, while 2024 revenues are expected to be 6% higher than 2023. The two-year 3.3% CAGR is decidedly anemic and reflects ongoing wholesale price compression, somewhat offset by positive impacts of new adult rec states. The 2025 growth rate should materially increase if, as we expect, several new states allow adult rec use in 2024 and capital markets reopen following regulatory reform in the second half of 2024.
- 2024 EBITDA estimates for the group are roughly unchanged from a month ago, but Verano (VRNO: CBOE), Cannabist (CBST: CBOE), and Jushi (JUSHF: OTCQX) are down 1%, 3%, and 4%, respectively. AYR (AYR.A: CSE), up 1%, is the only top ten MS0 with positive 2024 revisions.
- WHAT WILL IT TAKE FOR CANNABIS TO RE-EQUITIZE?
- The uncertainty regarding rescheduling timing (not many doubt that it will happen) and the realization that any movement on SAFER will now be in 2024 (at best) has frozen the cannabis capital markets.
- We had thought that a bit of strength in equity prices might encourage companies to re-equitize their balance sheets. Several companies, including TerrAscend and Curaleaf, did do minor issues. Still, they were motivated principally by the listing requirements of the TSX rather than any diligent effort to revamp balance sheets.
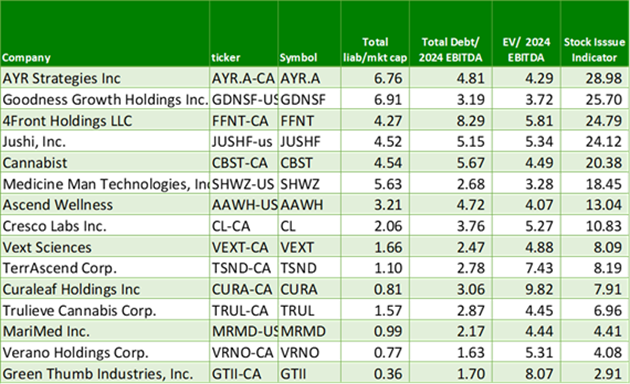
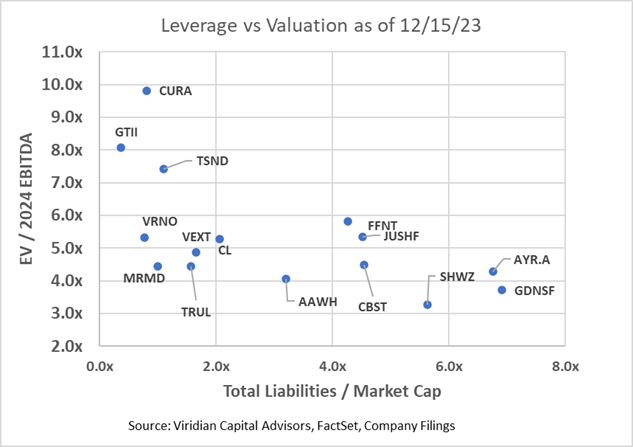
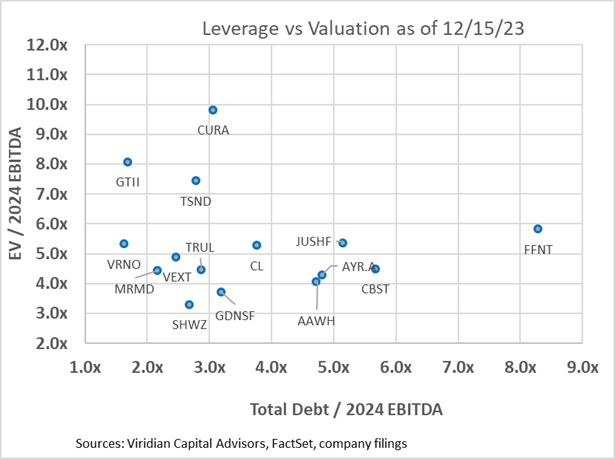
- The table and charts below help frame the likely candidates for additional issuance. Companies with high leverage but reasonable valuation parameters will likely follow with moderate-sized equity issuance. We expect companies will look to “average up” with the expectation of further price gains if rescheduling stays on course. Note we removed TILT from these charts because it appears as an outlier regarding total liabilities to market cap to make the rest of the chart unreadable.
- We created a rough index for likely equity issuance calculated as the multiplication of total liabilities to market cap and E.V./2024 EBITDA, reasoning that companies with high valuation ratios and high leverage should issue equity and reduce debt. Likely candidates include Cannabist (CBST: NEO), AYR (AYR.A: CSE), Jushi (JUSH: NEO), and 4Front (FFNT: CSE).
- DOES THE MARKET CARE ABOUT ANYTHING OTHER THAN RESCHEDULING?
- The HHS recommendation to reschedule cannabis to Schedule 3 dramatically impacted cannabis equity prices, propelling the MSOS ETF upwards by nearly 85%. But as of 12/15/23, the ETF was only up 35.7% from before the rescheduling news.
- The chart below shows enterprise to next-twelve-month valuation multiples now compared to previous times when positive regulatory/legislative news hit.
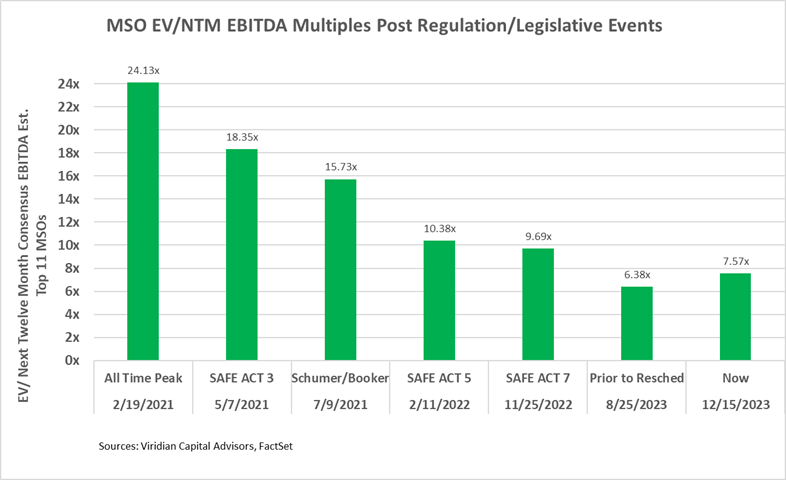
- EV/NTM EBITDA Multiples dropped 7.23% this week and are now 27.0% below levels after the 5th SAFE Act passage in the House in February 2022. Still, the rescheduling news is more significant as it dramatically impacts cash flows. We conclude that there is significantly more potential for multiple expansions. If valuations multiples rose to where they were after the announcement of the Schumer-Booker bill, the incremental gains would equal 107.8%.
- The table below demonstrates that for a hypothetical cannabis company with 50% gross margins, 20% SG&A, and 3x Debt/ EBITDA, 280e can result in effective tax rates (on pretax income) of over 100%.
- The table demonstrates our previous claim that debt/EBITDA over three times is unsustainable in a 280e world, as the calculated payback period for the debt would be an unacceptable 12.26 years. Cannabis companies under 280e need less than 2x debt/EBITDA to have acceptable 5-year payback periods. The table shows that combined effective rates (depending on state tax rates) would be reduced to around 27% without 280e, making a considerable difference in debt capacity.
- Without 280e, companies could comfortably carry 3x leverage with acceptable payback periods. By making interest expense tax deductible, the elimination of 280e also reduces the cannabis cost of capital and increases the intrinsic value of the firms.
- Removing 280e would still not support the level of debt we now see in the industry. Six of the top sixteen companies now have debt/2024 EBITDA over 4x, which is unsafe even without 280e, especially given ongoing cost inflation and wholesale price compression.

-
- We estimate annualized tax savings of the top 13 MSOs at $700M.
- WHAT IS HAPPENING TO TRADING VOLUME?

- WHAT IS HAPPENING TO TRADING VOLUME?
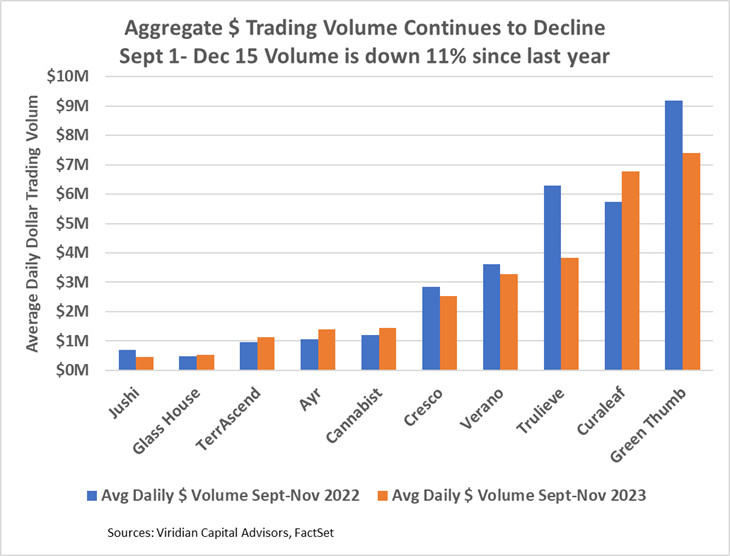
- Are we wrong to expect that cannabis stock trading volumes should be up year over year? After all, rescheduling, which should boost cannabis cash flows significantly, seems to be nearby. TerrAscend (TSND: TSX) and Curaleaf (CURA: CSE) have been uplisted to the TSX. (Curaleaf has not yet begun trading on the TSX but has gained conditional approval.) Similarly, Cannabist (CBST: CBOE) and Verano (VRNO: CBOE) are listed on the Canadian side of the CBOE, an exchange with more robust governance requirements than the CSE.
- Despite the good news, the aggregate daily dollar volume for the ten MSOs with the most trading volume is actually down by 11% from September 1, 2023, through December 15, 2023, compared to the same period last year.
- We note that some of the stocks mentioned above ARE trading better. Curaleaf is up 18%, Cannabist is up 22%, AYR is up 32%, and TerrAscend is up 18%. Those gains are more than made up for by the declines of 39% for Trulieve, 20% for GTI, and 35% for Jushi.
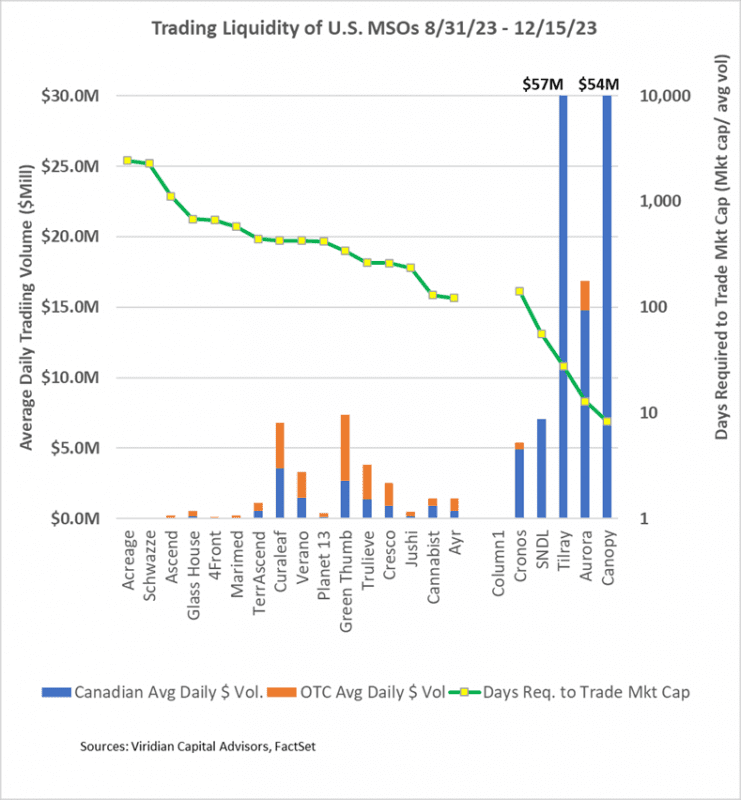
- The days required to trade the market cap indicator, shown by the green line below (measured on the right axis), continue to show tremendous illiquidity compared to the Canadian L.P.s, many of which trade on Nasdaq. For example, Curaleaf’s 428 days (significantly improved from 654 days as of last week) would mean that if an investor had a 5% position in Curaleaf and wanted to trade out of their position, assuming that they wish to represent less than 25% of the average daily volume, it would take them 86 days to sell out of the position! The same percentage position in Aurora could be traded in around three days. It’s a chicken and egg question; more institutional investors will increase trading volume, but the lack of volume keeps them from getting involved.
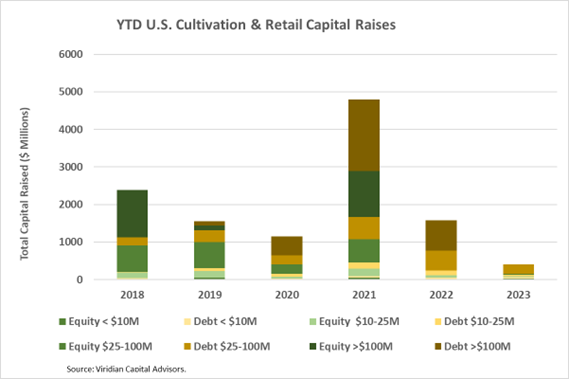
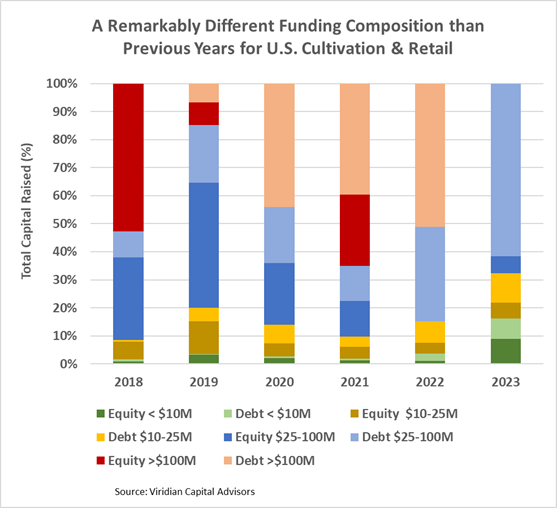
- YTD, U.S. Cultivation & Retail sector capital raises are down 74.4% from 2022 and are lower than any previous comparable period since before 2018
- Debt is still the dominant form of funding, accounting for 79.0% of all cultivation sector capital raised. 14.1% of the debt raised YTD has been for private companies.
- Large transactions are still absent from the market. There have been no debt or equity deals over $100M YTD. The graph below shows the strikingly different composition of U.S. Cultivation & Retail capital raises in 2023 compared to previous years, with small equity and midsized debt dominating raises.
- Cannabis equities (as measured by the MSOS ETF) were down 10.86% for the week.
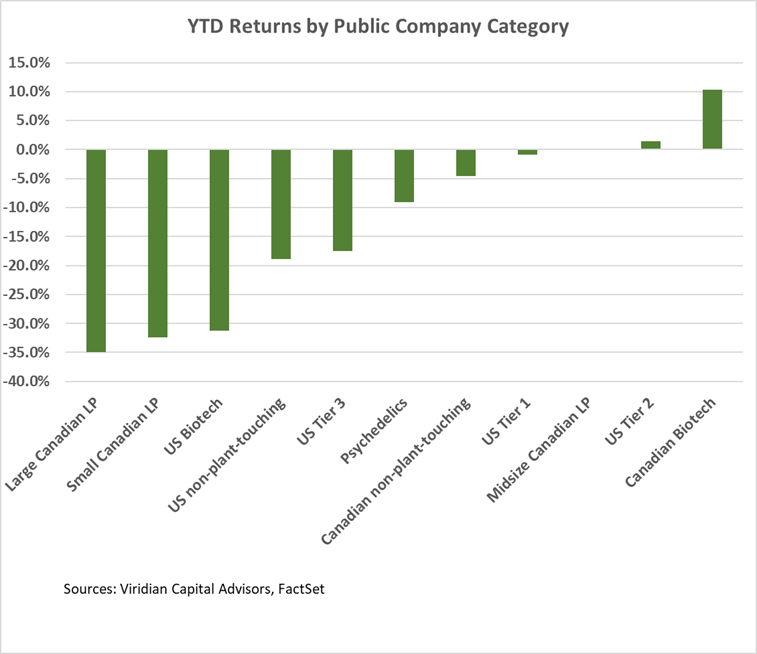
YTD Returns by Public Company Category:
- U.S. Tier One MSOs remained at #4 but dropped to a 1% YTD loss.
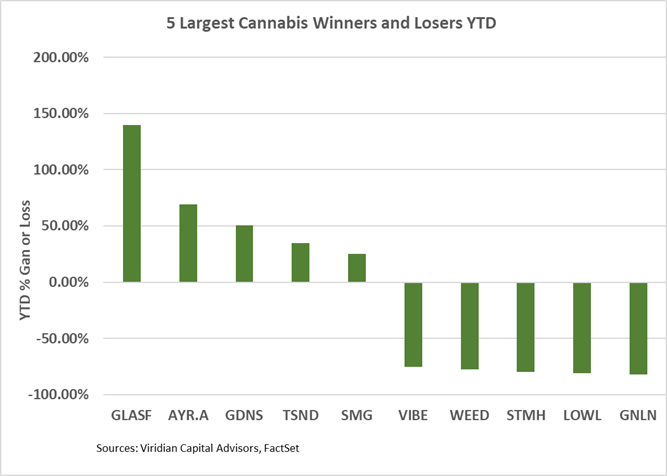
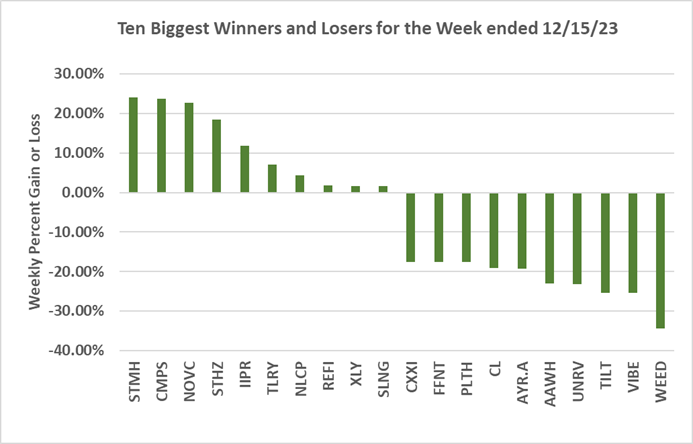
Best and Worst Performers of the last week and YTD: