OUR 9TH YEAR OF PROVIDING PROPRIETARY CAPITAL MARKETS INTELLIGENCE ON THE CANNABIS / HEMP / PSYCHEDELIC SECTORS
Each week, Viridian publishes insights and analysis on completed capital raise transactions in the prior week, focusing on all equity and debt deals. Our analysis includes:
- Summary
- Outlook
- Best & Worst Perfromers
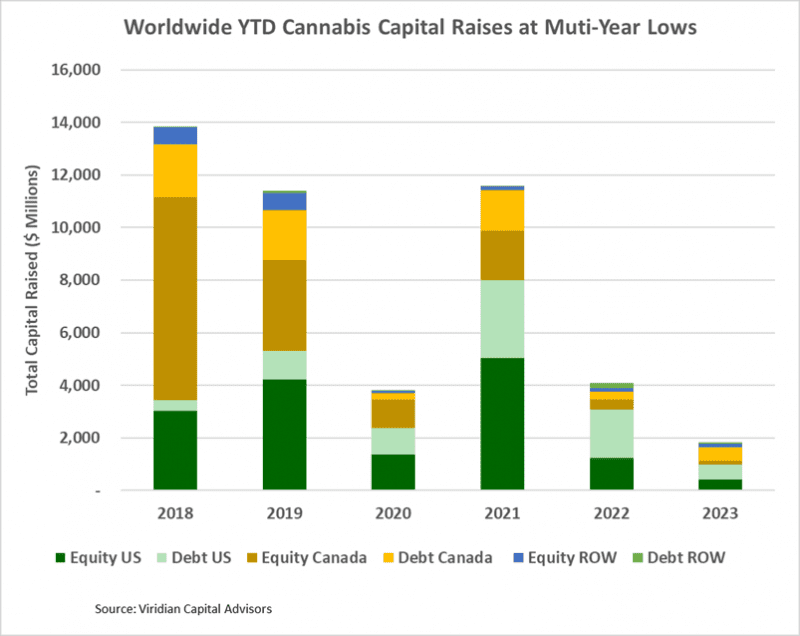
- Cannabis capital raises are running at a multi-year low. Only $1.84B closed through the first forty-eight weeks of the year compared to $4.08B last year.
- Debt represents 61.0% of total capital raised, significantly higher than in any other comparable period since before 2018.
- Public companies have raised 74.5% of total capital YTD, matching last year’s figure but otherwise lower than any comparable period since 2019.
- International raises accounted for 10.7% of the total, the most significant percentage since before 2018.
VIRIDIAN INSIGHTS
- WILL NEW YORK ACHIEVE ITS POTENTIAL?
- On November 27, the New York Cannabis Contol Board agreed to settle two lawsuits preventing the rollout of the state’s adult rec program. The lawsuits had prevented over 400 licensees from moving forward with their plans to open new dispensaries. The openings are critical to provide an outlet for the products that licensed cultivators have already grown and harvested.
- It is unclear whether this will truly fix the problems of the N.Y. rollout. A fully functional N.Y. market should have cannabis revenues over $3B, and the state was expected to have over $1B in 1st-year revenues. Instead, New York adult use revenues for 2023 are estimated to be less than $100M.
- The settlement seemingly paves the way for the rollout of the hundreds of legal dispensaries required to service the market, but questions remain. Will the new legal dispensaries be able to compete with the thousands of illicit retailers on product quality, selection, or price? California has battled this issue for years with little success. Will the Big Apple fair better?
- GIVING CREDIT WHERE CREDIT IS DUE
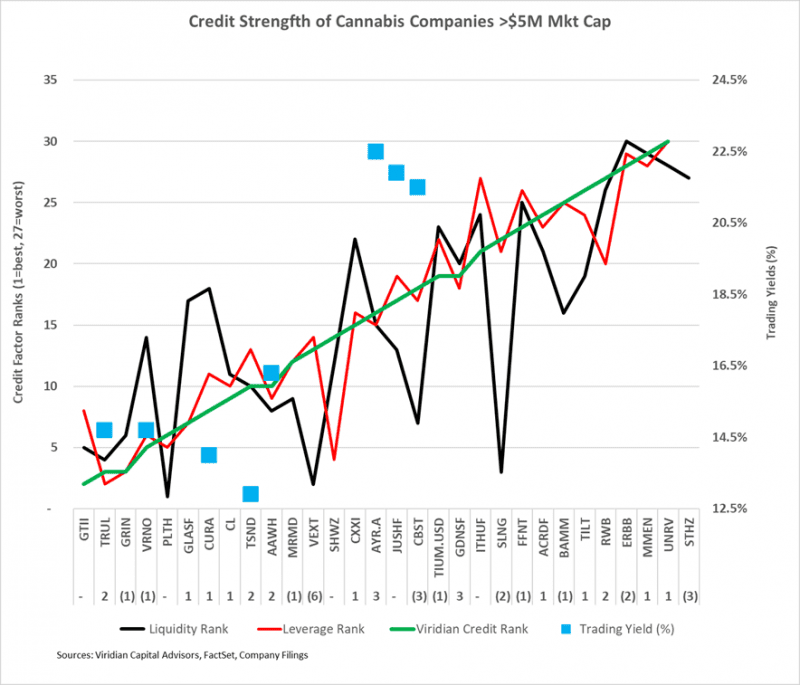
- The chart below shows our updated 12/1/23 credit rankings for the 30 U.S. cannabis companies with over $5M market cap. The number below the ticker symbol indicates the change in credit ranking since last week, where a negative number suggests credit deterioration, while a positive indicates improvement.
- The blue squares show the offered-side trading yields for each company.
- This week’s most dramatic decline was Vext’s six ranking slot decline (VEXT: CSE), which seriously missed its third-quarter projections.
- Debt pricing has improved modestly, and two companies (Curaleaf and TerrAscend) now look rich relative to our view of their credit quality. TerrAscend is understandable- the priced obligation is a loan with a one-year maturity, and we believe there is very little risk of a crisis at maturity. Nonetheless, Verano and Trulieve offer higher yields at what we believe to be lower risk.
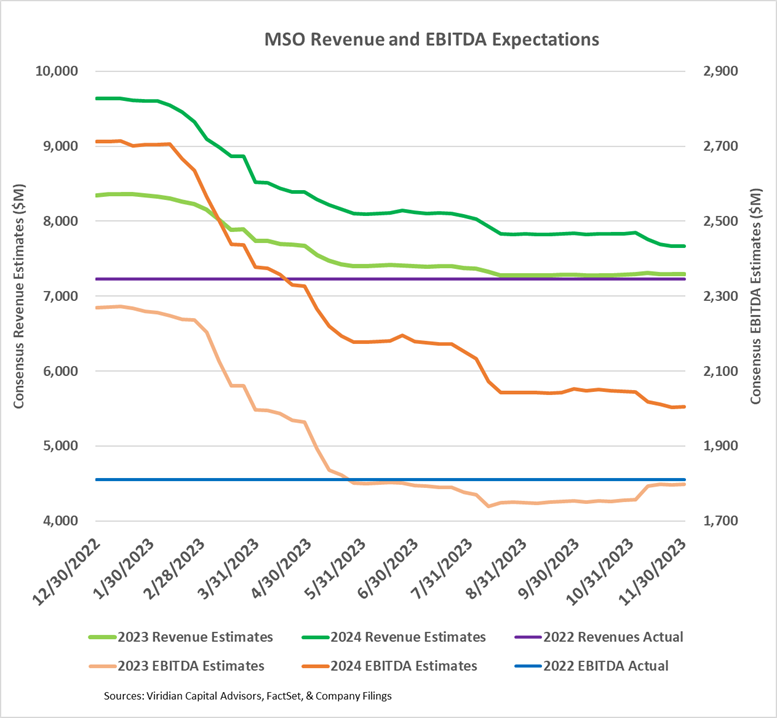
- NOT MUCH TO CHEER ABOUT IN 2023 AND 2024 CONSENSUS ESTIMATES
- Q3 earnings season is now over, and unsurprisingly, there was virtually no correlation between stock prices and revenue or EBITDA beats.
- Only six of the seventeen companies beat revenue estimates, and as a group, actual Q3 revenues of $1.95B were 2.2% below estimates. EBITDA performance was better: nine of the seventeen companies beat estimates, and aggregate EBITDA of $502M was 6.3% ahead of estimates.
- Surprisingly, given generally decent Q3 results, analysts’ revenue and EBITDA estimates have changed little since the rescheduling news but were adjusted upward slightly after the better-than-expected Q3.
- The graph below shows consensus revenue and EBITDA estimates for the 10 top MSOs for 2023 and 2024. 2023 consensus EBITDA margins of 24.7% are now 9%, below the beginning of the year expectations of 27.2% and 2022 actual margins of 25.0%.
- The green lines at the top show that 2023 revenues are expected to be 1% higher than 2022, while 2024 revenues are expected to be 6% higher than 2023. The two-year 3.3% CAGR is decidedly anemic and reflects ongoing wholesale price compression, somewhat offset by positive impacts of new adult rec states. The 2025 growth rate should materially increase if, as we expect, several new states allow adult rec use in 2024 and capital markets reopen following regulatory reform in the second half of 2024.
- 2024 EBITDA estimates for the group are down about 2% from a month ago. A 10% increase for TerrAscend (TSND: TSX) was more than erased by 9% and 14% declines for Cannabist (CBST: CBOE) and Jushi (JUSHF: OTCQX), respectively.
- WILL OHIO LEAD A PARADE OF NEW ADULT-USE STATES?
- Ohio voters passed Issue 2, making Ohio the 24th state to legalize adult-use cannabis.
- Ohio’s passage is important for several reasons. Now, more than one-half of the U.S. population lives in states where cannabis is legal for adult recreational use. This could be a “tipping point” where the walls begin to fall in other states.
- Pennsylvania is one such state that has been poised to enact adult rec for several years. The specter of lost tax revenues as P.A. residents cross the border to purchase weed may be the final impetus for legalization in P.A.
- Ohio also saw a development that we may see repeated in other states: Many Ohio voters came out to vote on Issue 1, a state constitutional amendment to protect abortion and reproductive rights. One of the issues that has been a stumbling block for cannabis legalization has been the fact that, unlike abortion, it was not an issue that drove people to the polls. Placing it on the ballot with abortion protection measures may change the entire voting calculus.
- Ohio’s legalization is significant in its own right. Ohio has an estimated population of about 11.7M. At usage rates similar to Illinois, the state adult market could support around $1.7B of annual legal cannabis sales, representing a nearly 6% increase in the national numbers. The third quarter results have shown how central adult rec legalization is to the industry’s growth. Stripping out Maryland, there was very little third-quarter revenue growth. State adult rec conversions in populous states like Ohio, Pennsylvania, and Florida may be more important than the SAFER Act. For a more in-depth analysis of the potential impact of new adult rec states, see this week’s Viridian Chart of the Week.
- WILL IT EVER BE SAFER?
- On Wednesday, September 27, The Senate Banking Committee passed the SAFER Act with a 14-9 vote, marking the first time members of the Senate have voted on the bill despite its passage in the House 7 times! We can quibble about the margin of victory and the timing, but it must be counted as a significant achievement to get this far.
- This year, there appear to be sufficient votes in the Senate from both sides of the aisle to pass the bill. However, additional drama from Senator Schumer is giving us a feeling of déjà vu. First, he continues to be unwilling to pass a clean, simple bill but intends to roll the HOPE and GRAM bills into SAFER before the Senate vote. HOPE provides the states with funding for expunging cannabis offenses while GRAM ends the prohibition on firearm sales to medical cannabis patients. Will he get greedy and try for even more? He is also talking about needing more support from Republicans before bringing the bill to a Senate vote. It’s like remembering a movie you didn’t like but can’t forget.
- SAFER now seems unlikely to see a vote in 2023. No government official has ever gotten voted out of office because they didn’t make cannabis a priority. With worries about Ukraine, Israel, and the budget sucking most of the air out of the room, it is only Biden’s desperation to find a winning issue that is likely to drive the bill forward.
- WHAT WILL IT TAKE FOR CANNABIS TO RE-EQUITIZE?
- The uncertainty regarding rescheduling timing (not many doubt that it will happen) and the realization that any movement on SAFER will now be in 2024 have frozen the cannabis capital markets.
- We had thought that a bit of strength in equity prices might encourage companies to re-equitize their balance sheets. Several companies, including TerrAscend and Curaleaf, did do minor issues. Still, they were motivated principally by the listing requirements of the TSX rather than any diligent effort to revamp balance sheets.
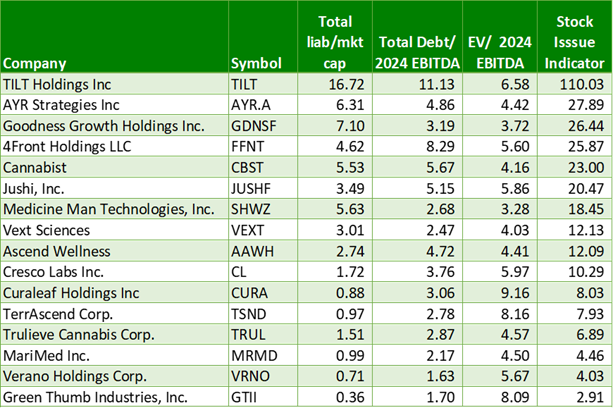
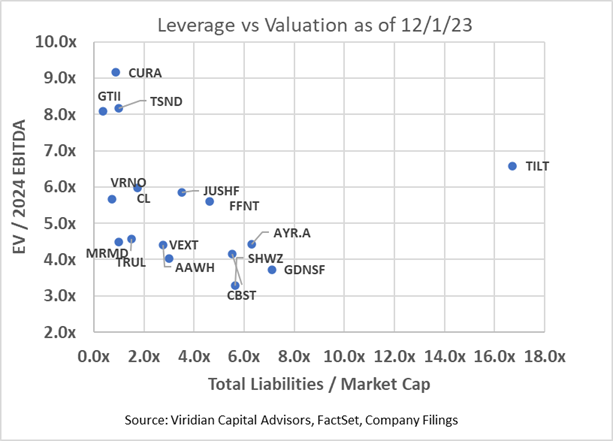
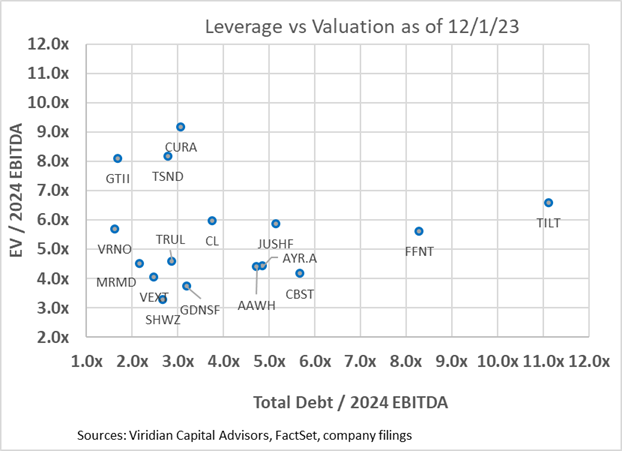
- The table and charts below help frame the likely candidates for additional issuance. Companies with high leverage but reasonable valuation parameters will likely follow with moderate-sized equity issuance. We expect companies will look to “average up” with the expectation of further price gains if rescheduling stays on course.
- We created a rough index for likely equity issuance calculated as the multiplication of total liabilities to market cap and E.V./2024 EBITDA, reasoning that companies with high valuation ratios and high leverage should issue equity and reduce debt. Likely candidates include Cannabist (CBST: NEO), AYR (AYR.A: CSE), Jushi (JUSH: NEO), and 4Front (FFNT: CSE).
- THE RESCHEDULING UPSIDE
- The HHS recommendation to reschedule cannabis to Schedule 3 dramatically impacted cannabis equity prices, propelling the MSOS ETF upwards by nearly 85%. But by 11/17/23, the ETF was only up 19.6% from before the rescheduling news.
- The chart below shows enterprise to next-twelve-month valuation multiples now compared to previous times when positive regulatory/legislative news hit.
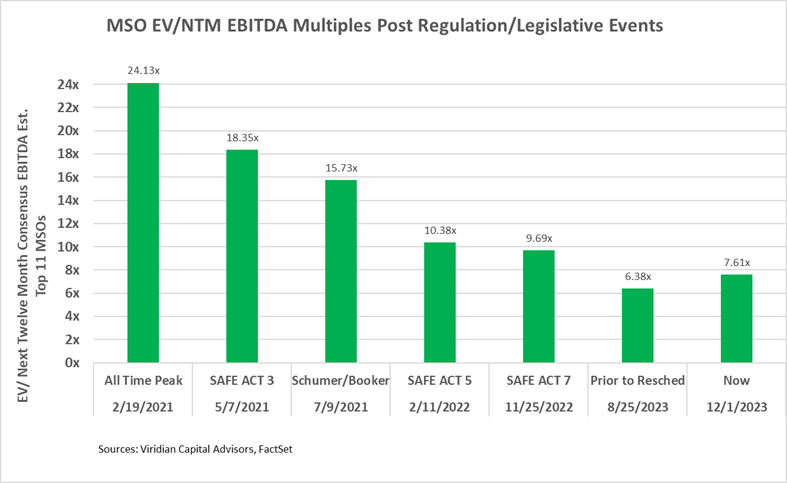
- Multiples are now 26.7% below levels after the 5th SAFE Act passage in the House in February 2022, but the rescheduling news is more significant as it dramatically impacts cash flows. We conclude that there is significantly more potential for multiple expansions. If valuations multiples rose to where they were after the announcement of the Schumer-Booker bill, the incremental gains would equal 106.7%.
- The removal of 280e would have a dramatic financial impact on plant-touching companies.
- The table below demonstrates that for a hypothetical cannabis company with 50% gross margins, 20% SG&A, and 3x Debt/ EBITDA, 280e can result in effective tax rates (on pretax income) of over 100%.
- The table demonstrates our previous claim that debt/EBITDA over three times is unsustainable in a 280e world, as the calculated payback period for the debt would be an unacceptable 12.26 years. Cannabis companies under 280e need less than 2x debt/EBITDA to have acceptable 5-year payback periods. The table shows that combined effective rates (depending on state tax rates) would be reduced to around 27% without 280e, making a considerable difference in debt capacity.
- Without 280e, companies could comfortably carry 3x leverage with acceptable payback periods. By making interest expense tax deductible, the elimination of 280e also reduces the cannabis cost of capital and increases the intrinsic value of the firms.
- Removing 280e would still not support the level of debt we now see in the industry. Six of the top sixteen companies now have debt/2024 EBITDA over 4x, which is unsafe even without 280e, especially given ongoing cost inflation and wholesale price compression.

-
- We estimate annualized tax savings of the top 13 MSOs at $700M.
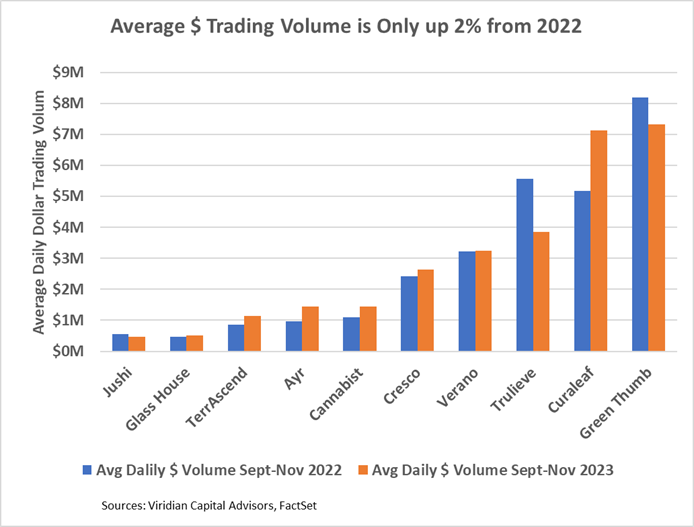
- THE CANNABIS STOCK LIQUIDITY SURGE IS SLOWING DOWN
- Uplistings to TSX and CBOE have increased the trading liquidity of cannabis stocks, but the gains are starting to level out, and neither the TSX nor the CBOE compares with the liquidity of Nasdaq.
- The graph below compares the average daily dollar trading volume for the ten highest volume MSOs between 8/31/23 and 12/1/23 and the equivalent period in 2022. The aggregate average daily dollar volume for the group is now only up 2% after measuring 35% around a month ago. Gains range from -31% for Trulieve (TRUL: CSE) to 48% for AYR (AYR.A: CSE)(AYRWF: OTCQX). Why are volume gains slowing?
- Despite daily volume gains, the days required to trade the market cap indicator, shown by the green line below (measured on the right axis), continue to show tremendous illiquidity compared to the Canadian L.P.s, many of which trade on Nasdaq. For example, Verano’s 482 days would mean that if an investor had a 5% position in Verano and wanted to trade out of their position, assuming that they wish to represent less than 25% of average daily volume, it would take them 96 days to sell out of the position. The same percentage position in SNDL could be traded in under ten days.

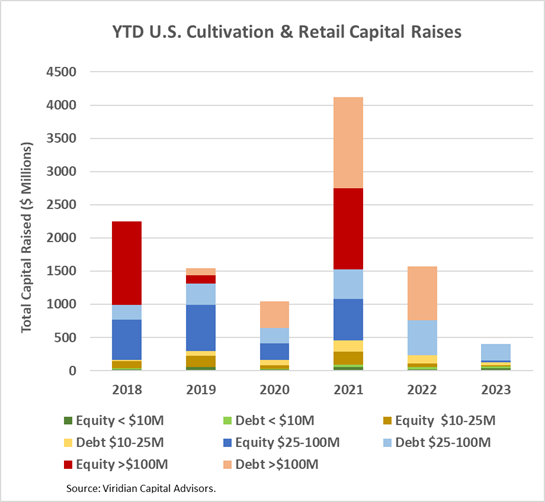
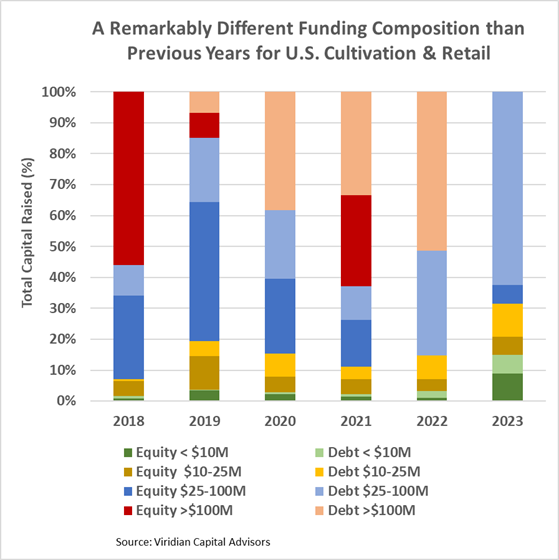
- YTD, U.S. Cultivation & Retail sector capital raises are down 73.9% from 2022 and are lower than any previous comparable period since before 2018.
- Debt is still the dominant form of funding, accounting for 79.2% of all cultivation sector capital raised. 14.1% of the debt raised YTD has been for private companies.
- Large transactions are still absent from the market. There have been no debt or equity deals over $100M YTD. The graph below shows the strikingly different composition of U.S. Cultivation & Retail capital raises in 2023 compared to previous years, with small equity and midsized debt dominating raises.
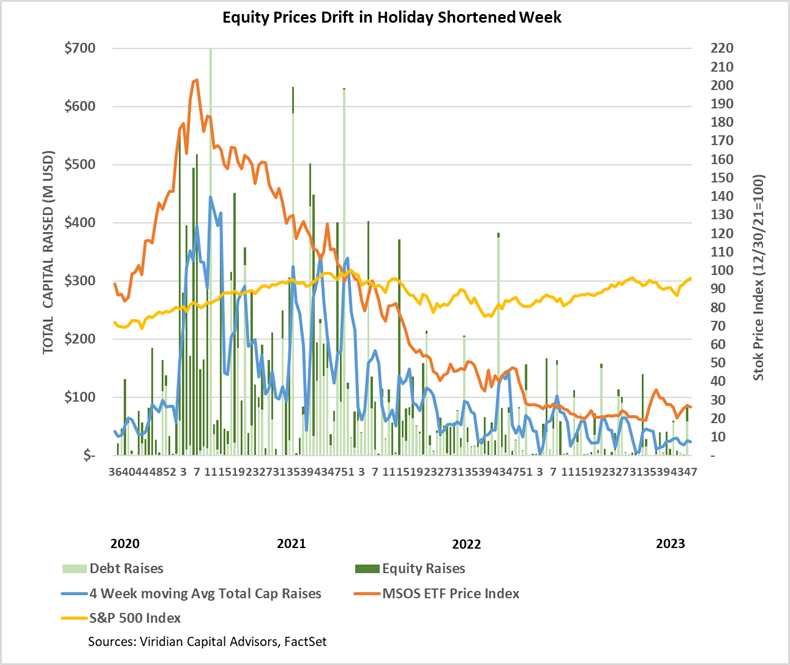
- Cannabis equities (as measured by the MSOS ETF) were down 2.67% for the week.
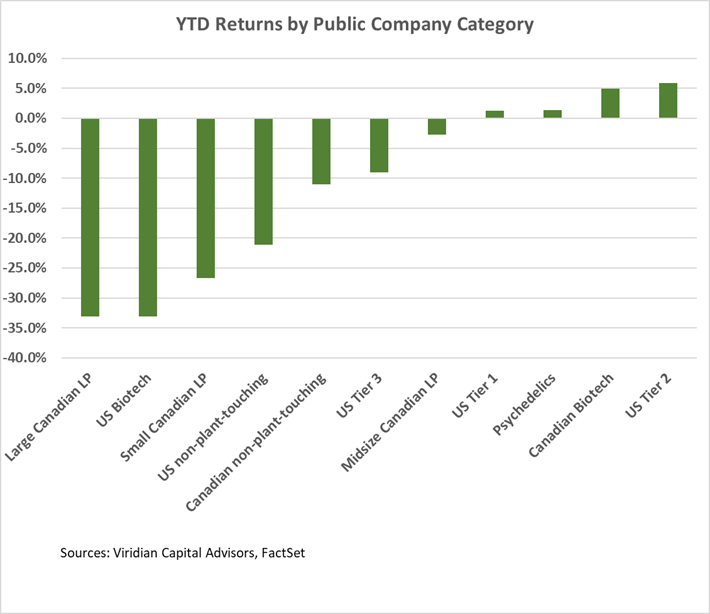
YTD Returns by Public Company Category:
- Psychedelics have regained the lead in YTD gains over Tier one U.S. MSOs after trailing for several weeks.
Best and Worst Performers of the last week and YTD:
- Ascend (AAWH: OTCQX)(AAWH.U: CSE) topped the gainers list with a 14.9% increase, repeating its presence on the winner’s list from last week. Ascend had 3rd quarter results that were even stronger than the beat it had pre-announced. The company is cutting costs and rationalizing its balance sheet.
- The losers list is predominantly populated with companies from the lower quartile of our credit rankings, including Acreage (ACRDF: OTCQX). Greenlane (GNLN: OTCQX), Lowell (LOWL: CSE), and StateHouse (STHZ: CSE).
- Vext Science (VEXT: CSE) appeared on the losers list for the first time after announcing disappointing 3rd quarter results. Revenues and EBITDA were 12.7% and 51.5% below consensus estimates.

